What is Blackfire?
Welcome to Blackfire, your Continuous Observability Solution.
Blackfire empowers your to monitor your applications' real-time behavior and proactively identify existing bottlenecks or the consequences of upcoming changes before they reach production.
By speeding up the discovery process and allowing long-term performance optimization, Blackfire lets you stay in control, even during crises, to build and grow your applications confidently.
Blackfire provides a comprehensive view of performance issues, allowing you to quickly drill down from a high-level overview to pinpoint root causes at the function or service call level.
Across all of your sites and testing pipelines, get actionable reports and insights, which help you fix issues and enforce long-last improvements.
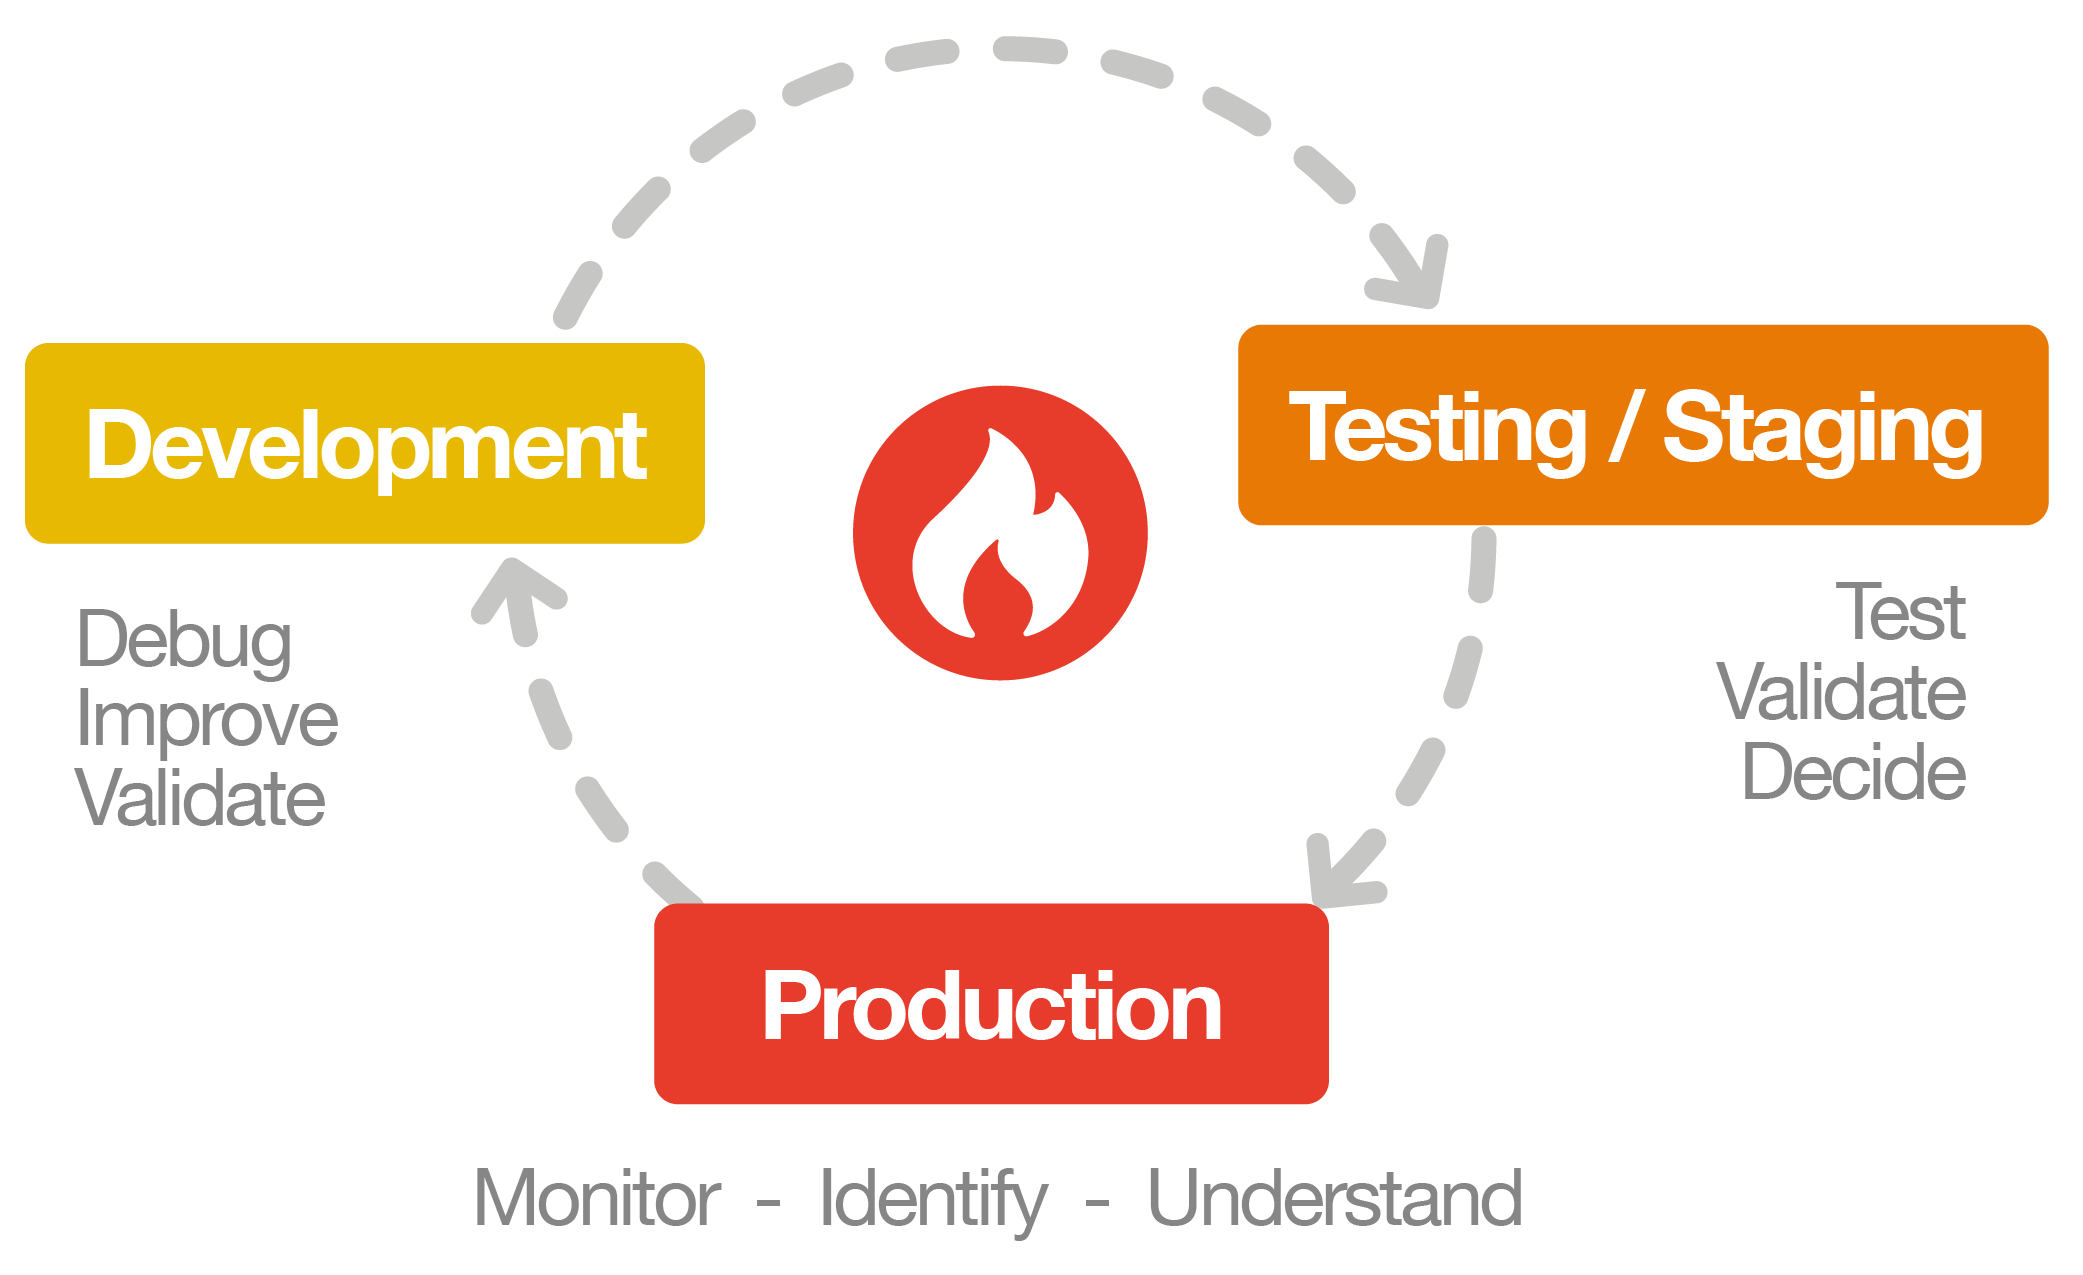
Blackfire helps you to improve web applications' performance at each step of its lifecycle: from development to test, staging and production.
Continuous Profiling
Blackfire's continuous profiling let you maximize performance efficiency with real-time insights:
- Quickly identify performance bottlenecks and improve the most resource-intensive parts of your applications.
- Benefit from low overhead and holistic observability.
- Immediate bottleneck identification with continuous monitoring of your£ application and analysis of code execution.
Monitoring
Monitoring a web application is about collecting performance metrics on live traffic, usually in production, sometimes in staging.
It is a key feature to detect when something is going wrong in your application, and give you high-level pointers to understand which transaction is consuming most of the server resources. Blackfire also breaks down that information into time spent within the application, and time spent within external services (eg HTTP, SQL, Queues, etc.).
To avoid impacting your end-users the metric collection techniques ensure a very light, or even non-existing overhead. It also means that the depth of metrics is limited. This is where our profiler shines.
Profiling
Blackfire's Deterministic profiler collects deep performance metrics while the code is running, and have full details and context on the code's behavior to find the root cause of performance bottlenecks.
A profile includes information on the number of calls per function, caller-callee relationships, wall-time, I/O time, CPU time, memory, network, HTTP calls and SQL queries. Two visualization options, the call-graph and the timeline, let you view the code's behavior as a relational graph, or across time.
A key advantage of Blackfire's profiler technology is that it can run safely in production, with no impact for end-users when profiling HTTP requests. By default, profiles run on synthetic requests, generating no overhead on real traffic.
Blackfire also offers more advanced profiling techniques, which you can discover in this documentation (real end-user requests, crons, scripts, and more).
Testing
Beyond traditional monitoring, and profiling techniques, Blackfire offers unique features to let you integrate performance testing anywhere in your QA practices. Integrate with CI/CD, unit tests, tests upon deployment, or run Synthetic User Monitoring.
Write assertions to verify that your code behaves as expected, and that it respects your performance budget.
Benefit from default assertions, our fully documented recommendations, to have Blackfire warn you with no further effort from you when it detects something wrong in the performance, quality or security of your code.
A Unique Blend of Features
Blackfire is the only tool to offer natively integrated monitoring, advanced determinist and continuous profiling and testing features. Thanks to that blend, get actionable insights and reports so that you can fix issues rather than spend time finding them.
To better understand how Blackfire works, check our doc on the Blackfire stack.
What's Next?
Head to our dedicated onboarding section to be guided at every step of your way into getting the most out of Blackfire.
Stop firefighting, today.