Analytics
Requires Production Plan
Blackfire Analytics gives you a complete picture of how users interact with your application, from top-performing pages to high-traffic transactions, popular browsers, and UTM campaign effectiveness.
This feature helps you make smarter product decisions and prioritize your improvements based on real user behavior and traffic patterns.
Privacy-First by Design
Blackfire Monitoring and Analytics respects your users' privacy. We do not track individual users, set cookies, nor store personally identifiable information (PII).
That means:
- No cookie banner needed
- Fully GDPR-compliant by default
- No impact on user consent flows
You get actionable insights about how your app is used without compromising user trust or compliance.
Metrics & Dimensions
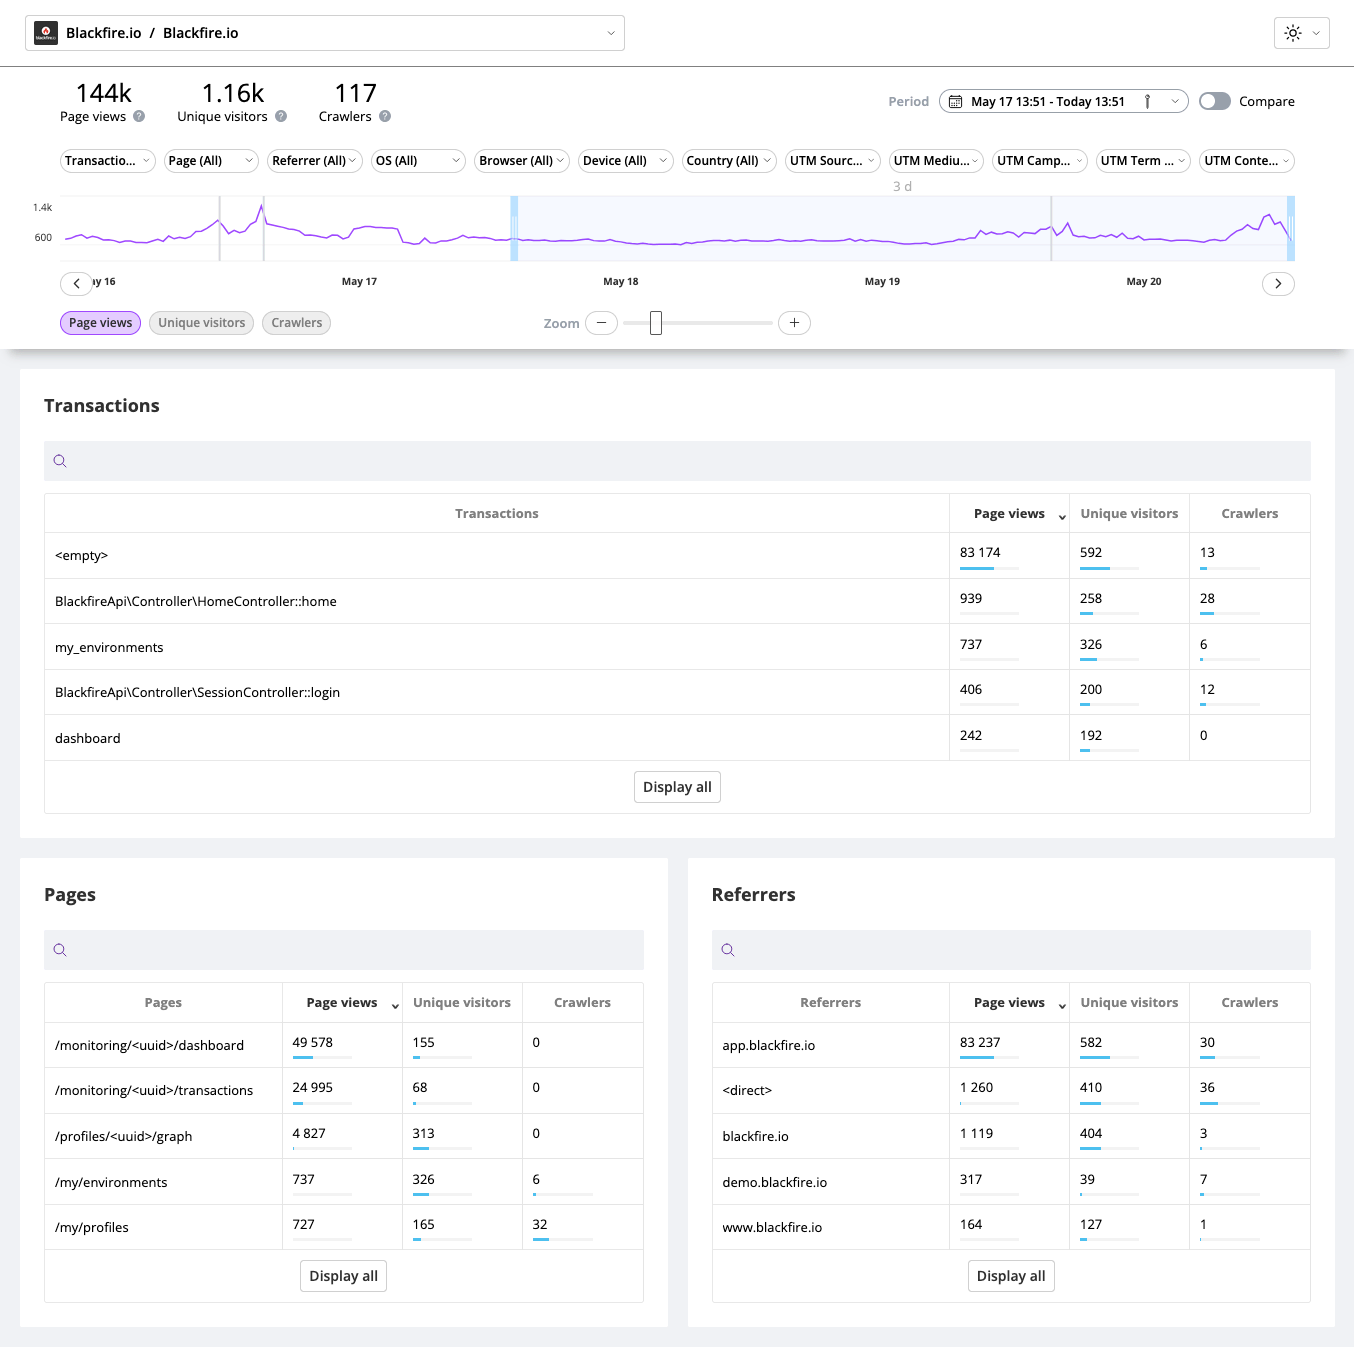
Blackfire Analytics provides the Page views, Unique Visitors, and Crawler traffic information for the following:
- Transactions
- Pages
- Referrers
- UTM: Media, Sources, Campaigns, Contents, Terms
- Browsers
- Browser Versions
- Devices
- OS
- Countries
Geographic Distribution
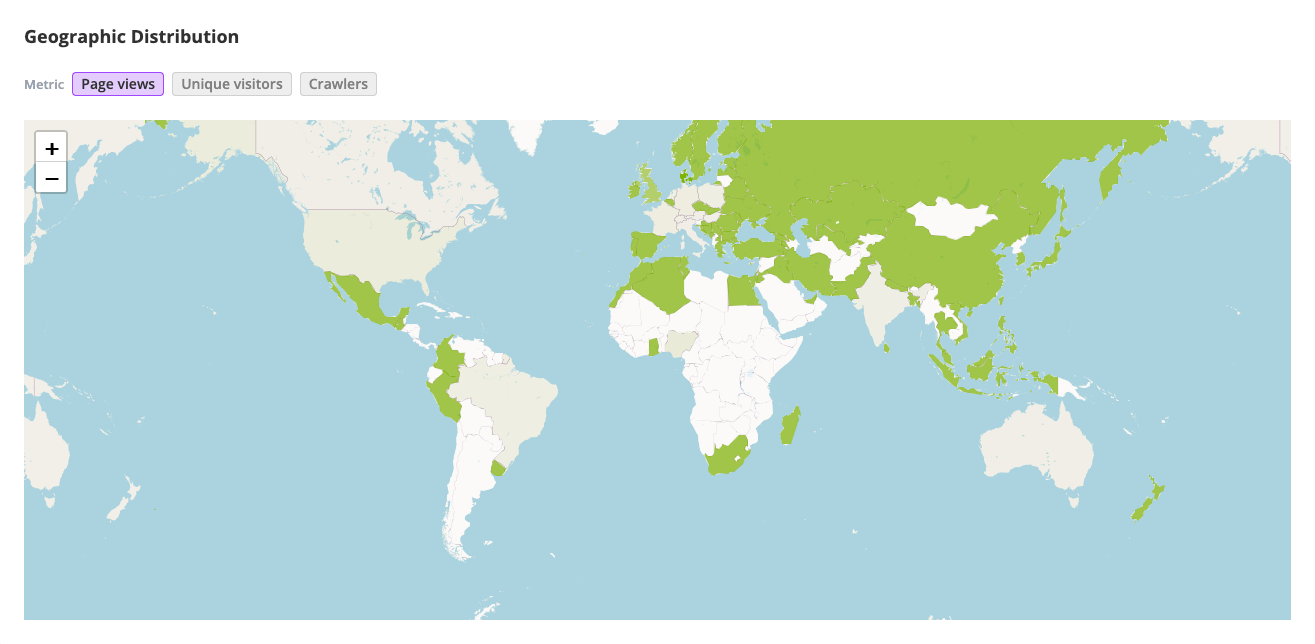
The Geographic Distribution map gives you a visual breakdown of the traffic across the world. This helps you quickly identify where your users are coming from.
Timeframe Comparison
Blackfire Analytics dashboard allows comparing two timeframes to better understand the traffic dynamics in various contexts.
Enabling comparison mode
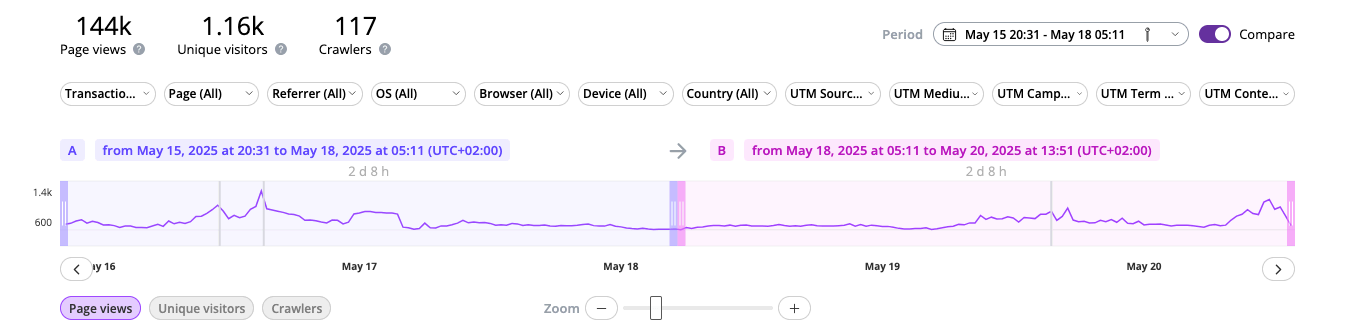
A toggle on the top right corner of the analytics dashboard enables the comparison mode.
Once comparison enabled, you can select two timeframes referred to as A and
B. Those times can overlap.
Understanding analytics visual comparison
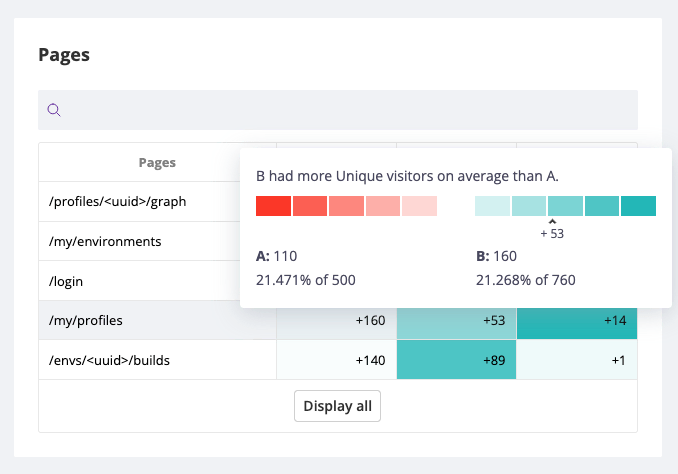
The different tables provides a visual representation of how timeframe B
compares to A for the selected dimension using shades of colors. The stronger
the color, the higher traffic variation.
A scale and contextual information are displayed when hovering a span. This ensures accessibility for all users and allow colorblind users to benefit from this feature.