Loading...
Browsing Browser Traces
Browser Monitoring now lets you explore individual traces to investigate specific user sessions.
Accessing Trace Details
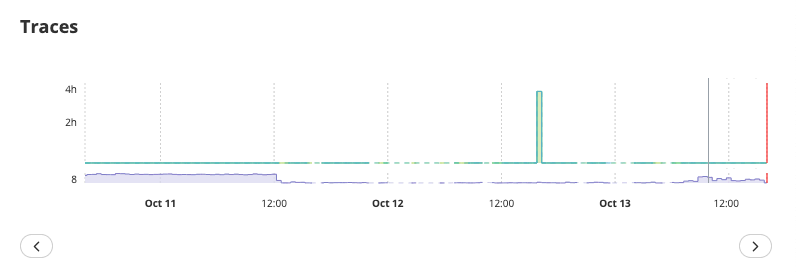
Click Browse Trace in the Browser Overview section to open a detailed trace view.
Each trace represents a user visit, including page loads, navigation events, and fetched resources.
You can:
- Move between traces using the Previous/Next buttons.
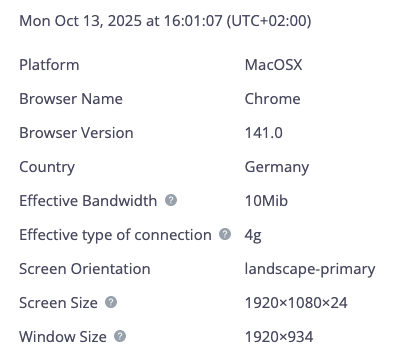
- View session details such as platform, browser version, country, screen size, and timestamp.
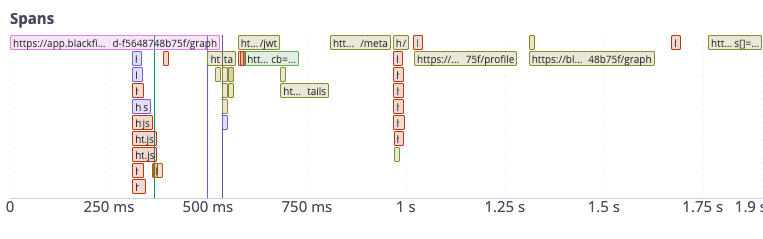
- Inspect each fetched resource (span) to understand how it was loaded.
- Hover over a span to see technical details such as:
-
- Resource type and URL
- Transfer size and compression rate
- DNS lookup, TCP handshake, and wait times
- Download duration
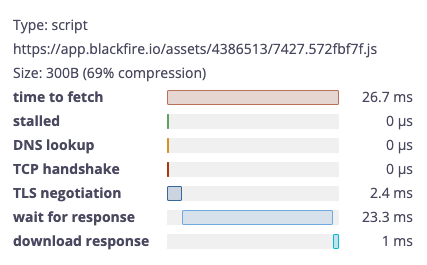
Depending on the trace, some or all of these breakdowns may be available.
Visitor Journey
For Single-Page Applications (SPA) or multi-page flows, the trace view also provides a Visitor Journey timeline.
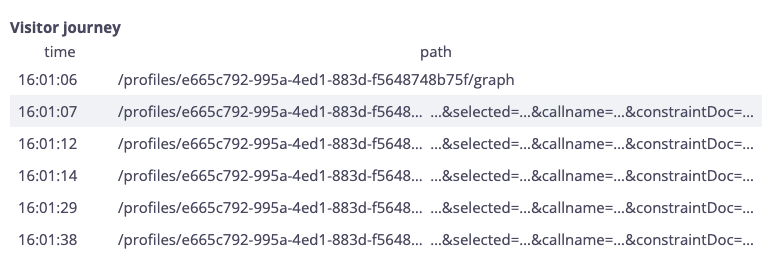
This shows the sequence of user interactions and navigation events during the session, allowing you to correlate specific performance behaviors with the exact user journey.