Blackfire Monitoring Dashboard
Requires Production Plan
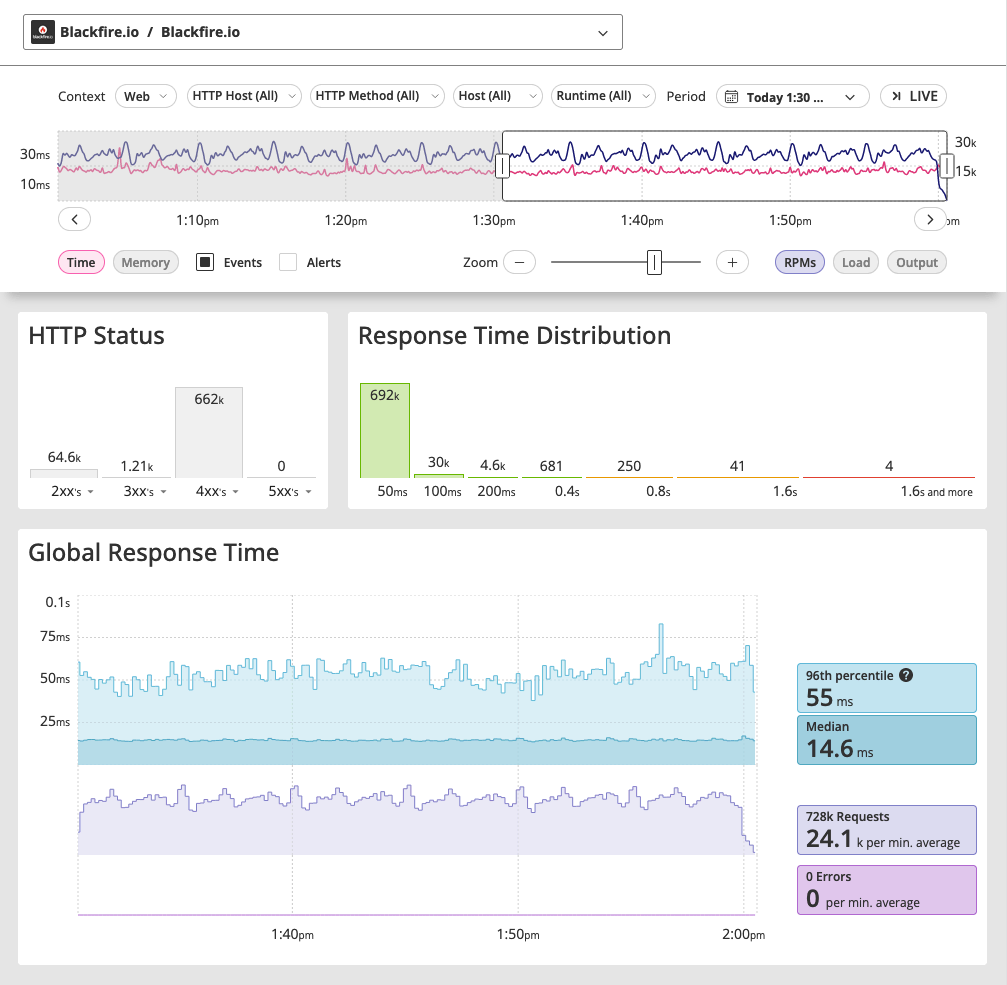
Blackfire monitoring takes a holistic approach to continuous observability, providing a bird's-eye view of the health of your applications enabling you to identify and drill down on performance issues.
Not only can you discover what issues occurred but when and where they happened as well.
The interactive dashboard lies at the heart of Blackfire monitoring. It allows you to filter monitoring data based on HTTP host, HTTP method, host, and runtime.

The monitoring dashboard offers a range of insightful performance metrics, such as response time, memory usage, requests per minute (RPM), load, and output, providing a comprehensive understanding of your application's health.
Response time analysis
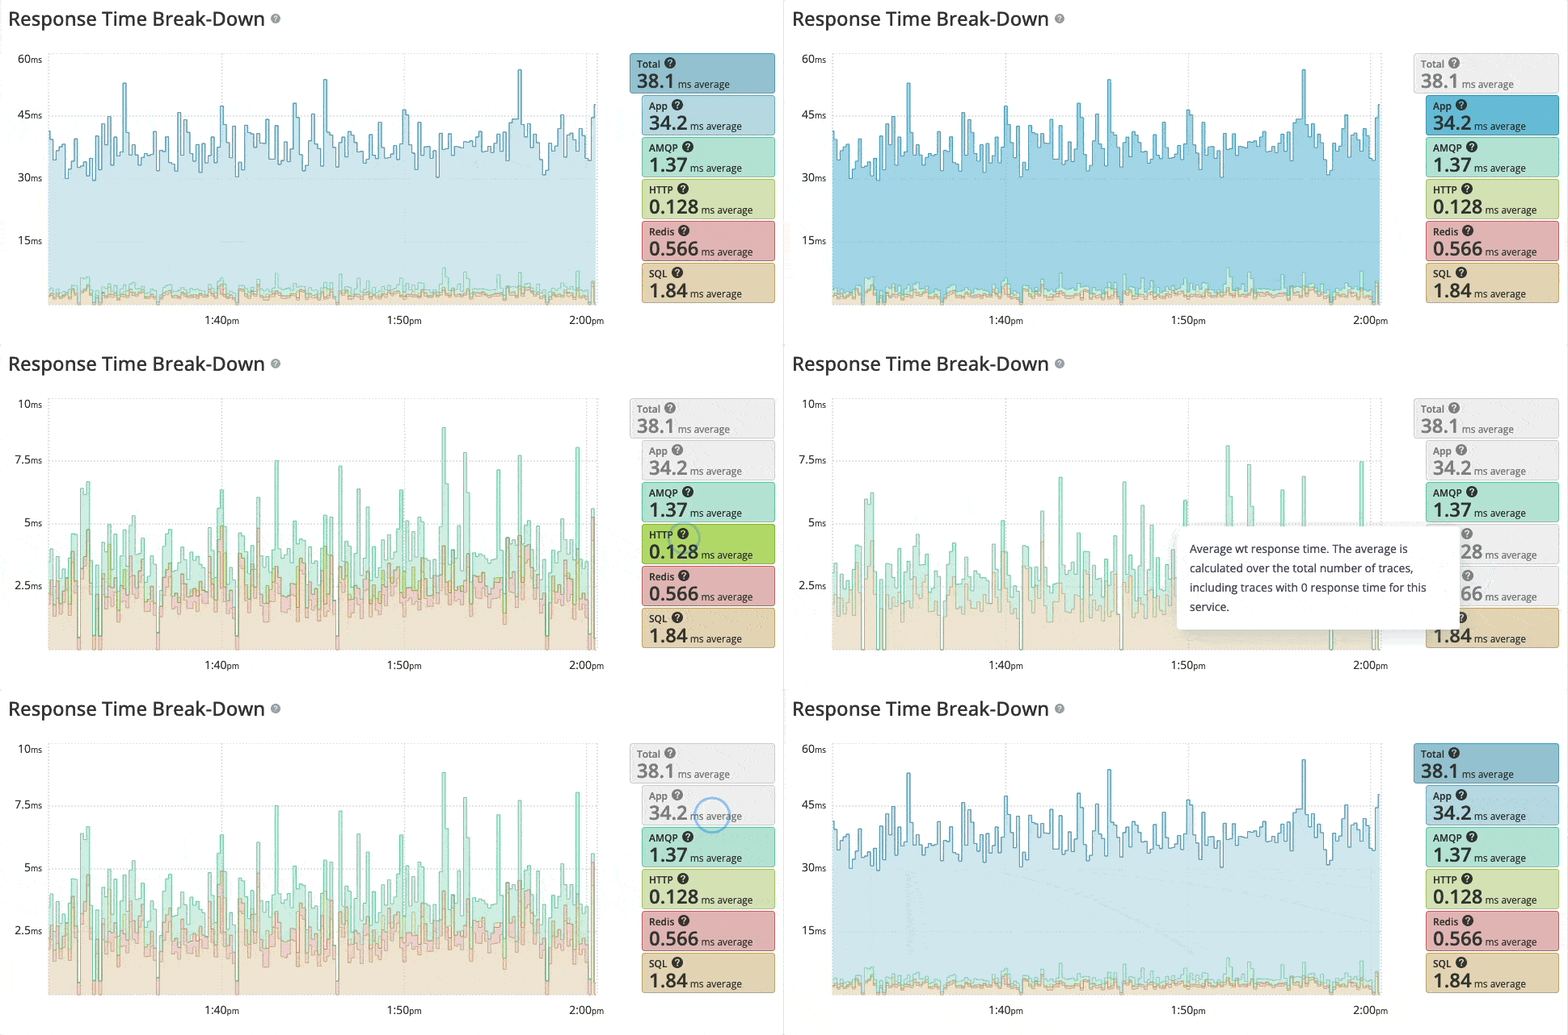
One of Blackfire monitoring's most valuable features is its ability to break down the response time per layer of service.
This granular look into your application's response time helps you locate any inefficiencies or bottlenecks in specific layers, allowing you to prioritize your optimization strategies effectively.

The performance issues you are trying to understand and solve might not originate within your code, but within the services you rely on. It's also maybe due to how your applications handle those services.