Chapter 21 - Profiling the Frontend
Before end-users interact with your website in a browser, they need to wait for a number of things to happen: initialization (DNS resolution, TCP connection, proxy, and SSL negotiation), server rendering, data transfer, and page rendering in the browser.
Blackfire helps you improve the performance of server rendering, but what about the other parts of the equation?
If you set aside server rendering time, most of the time a user spends waiting for a page to load is spent in the browser. There are so many things to do before the page is fully usable by the end user: first and foremost, a web page is composed of many resources besides the main contents that the browser has to resolve and load (JavaScripts and stylesheets). Then it needs to build the DOM tree from the HTML and execute any needed JavaScript. Last but not least, extensions that you installed in the browser can have an impact as well.
Websites and many mobile applications rely on the same underlying technologies like HTTP, DNS, SSL, etc. But for mobile applications, the latency, the bandwidth, and the limited amount of resources on phones make everything more challenging. Speed matters, even on mobile — and perhaps especially on mobile.
Improving server performance is made simpler as you know everything about your infrastructure: the number of servers, their CPU, memory, bandwidth, location, and more. Client performance is much harder as users can have very different setups: location, bandwidth, computer power, internet connectivity, etc. These constraints all influence a user's experience and they are all out of your control.
This chapter is a quick overview of the tools you can use to understand and improve your application's frontend performance.
HTTP
Improving the time it takes for a webpage to be usable by a user starts with HTTP optimizations. A quick overview is given by Google's timeline:

If you want to learn more about how a browser handles HTTP and possible optimizations, read Page Weight Doesn't Matter.
The Google Chrome Network tab also summarizes HTTP interactions with the user quite nicely:

The "`High-Performance browser network <https://hpbn.co/>`_" book is a great resource for an in-depth analysis of network performance.
HTML and JavaScript
A browser renders a page in three basic stages: when it finishes retrieving the web contents from the server, when the interface starts to be understandable by the user (most elements are displayed), and when the user can fully interact with the page (all stylesheets and JavaScripts have been loaded and evaluated).
To get a quick overview of the browser performance of your application, use Google PageSpeed Insights. This tool does indeed give you great insights.
The W3C Navigation Timing recommendation allows you to "access timing information related to navigation and elements" programmatically from JavaScript.
When the Google Chrome Team introduced the RAIL model, Paul Irish started with this great advice:
There's no shortage of performance advice, is there? The elephant in the room is the fact that it's challenging to interpret: Everything comes with caveats and disclaimers, and sometimes one piece of advice can seem to actively contradict another. Phrases like "The DOM is slow" or "Always use CSS animations" make for great headlines, but the truth is often far more nuanced.
RAIL is a model that helps you avoid performance issues by setting general performance goals. RAIL stands for:
- Response (user interface): Tap to paint in less than 100ms;
- Animation: Layout rendering should take less than 16ms per frame;
- Idle: Use idle time to compute some work in chunks of 50ms;
- Load: The page should be fully loaded in less than 1000ms.
If you want to dive more in RAIL, watch the "`Dev Tools: State of the Union <https://www.youtube.com/watch?v=FfGqP8Sqxcc>`_" talk.
Let's see how these goals can be observed and improved.
R for Response
When a user interacts with a page by clicking a button or submitting a form, you can either load a new page or asynchronously load data to render a React component or populate an Angular scope.
For any interface change, 100ms is the performance goal you should target after the user triggers it from the interface. If not, you should use a loader, a progress bar, or anything that will help the user understand that the action has been taken into account.
A for Animation
Animations are exceptionally smooth for end users at 60 frames per second. That gives you 16ms per frame.
16ms is even too much according to this article:
Each of those frames has a budget of just over 16ms (1 second / 60 = 16.66ms). In reality, however, the browser has housekeeping work to do, so all of your work needs to be completed inside 10ms. When you fail to meet this budget the frame rate drops, and the content judders on screen. This is often referred to as jank, and it negatively impacts the user's experience.
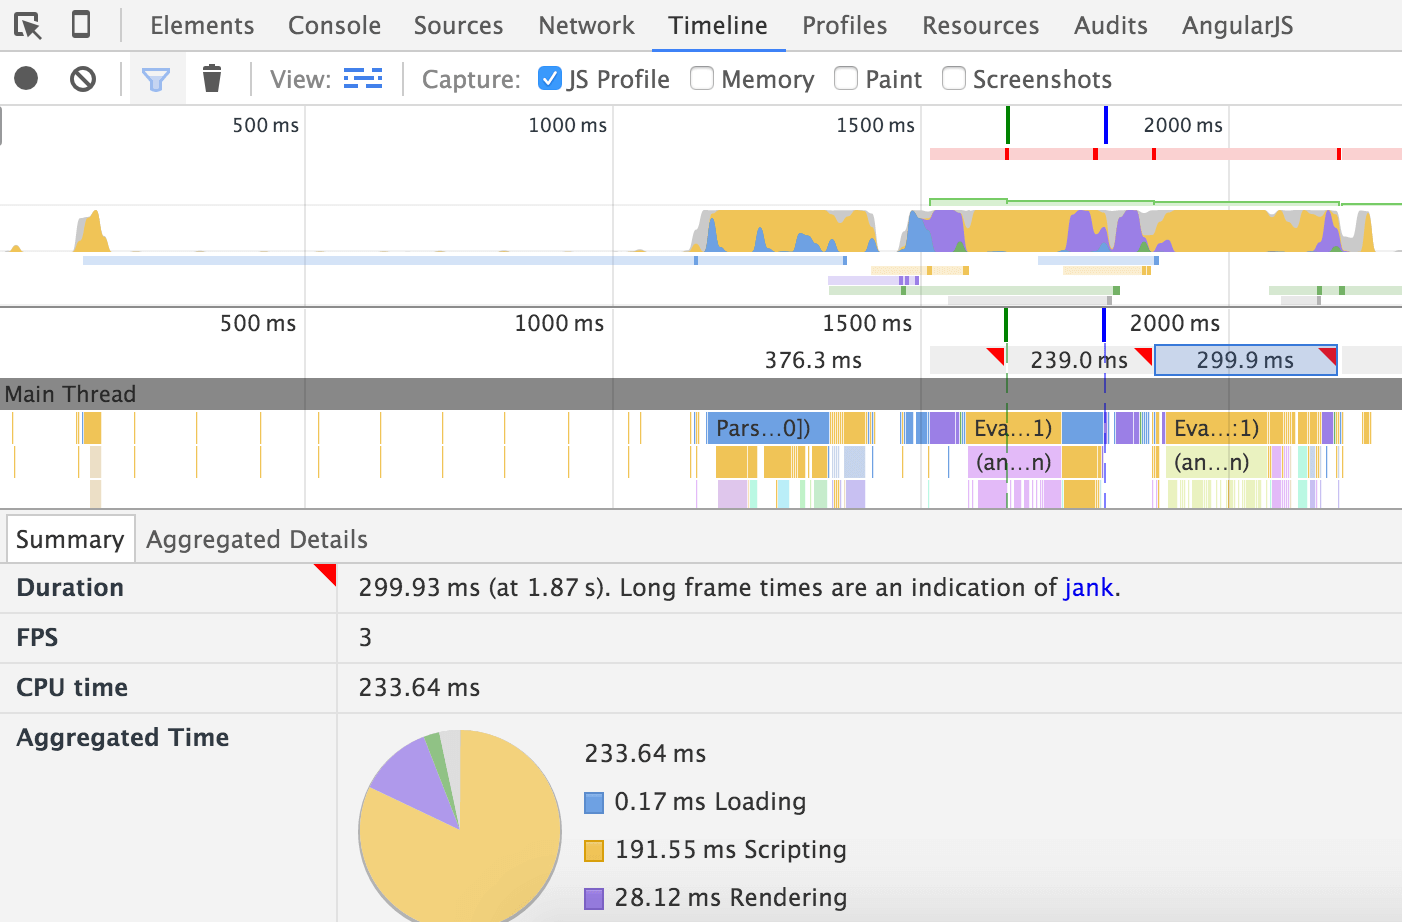
You can spot janks in your pages by having a look at the "Timeline" tab of the Google Chrome developer toolbar; janks are reported with a red corner:

I for Idle
To avoid blocking the user interface with JavaScript, you should try to split computational tasks into small chunks and take advantage of the Page Visibility API to defer processing until when the user is idle.
Each of these chunks of idle-time work should not take more than 50ms to complete. If you have a larger task that is difficult to optimize into 50ms chunks, consider delegating this work to a web-worker. Executing JavaScript in a web-worker is like creating a new independent thread outside the page event loop. Communication with this thread happens through a messaging API. Read the Mozilla Web Worker documentation to learn more about this technique.
You can also read this very nice tutorial explaining how to build a Pokemon application.
Another important consideration when writing JavaScript is function calls that result in a browser flush of all pending changes. When creating DOM nodes, updating DOM node classes, or even when adding CSS properties, the requested changes are queued waiting for an upcoming refresh of the interface. Knowing which function calls trigger an early flush can help.
L for Load
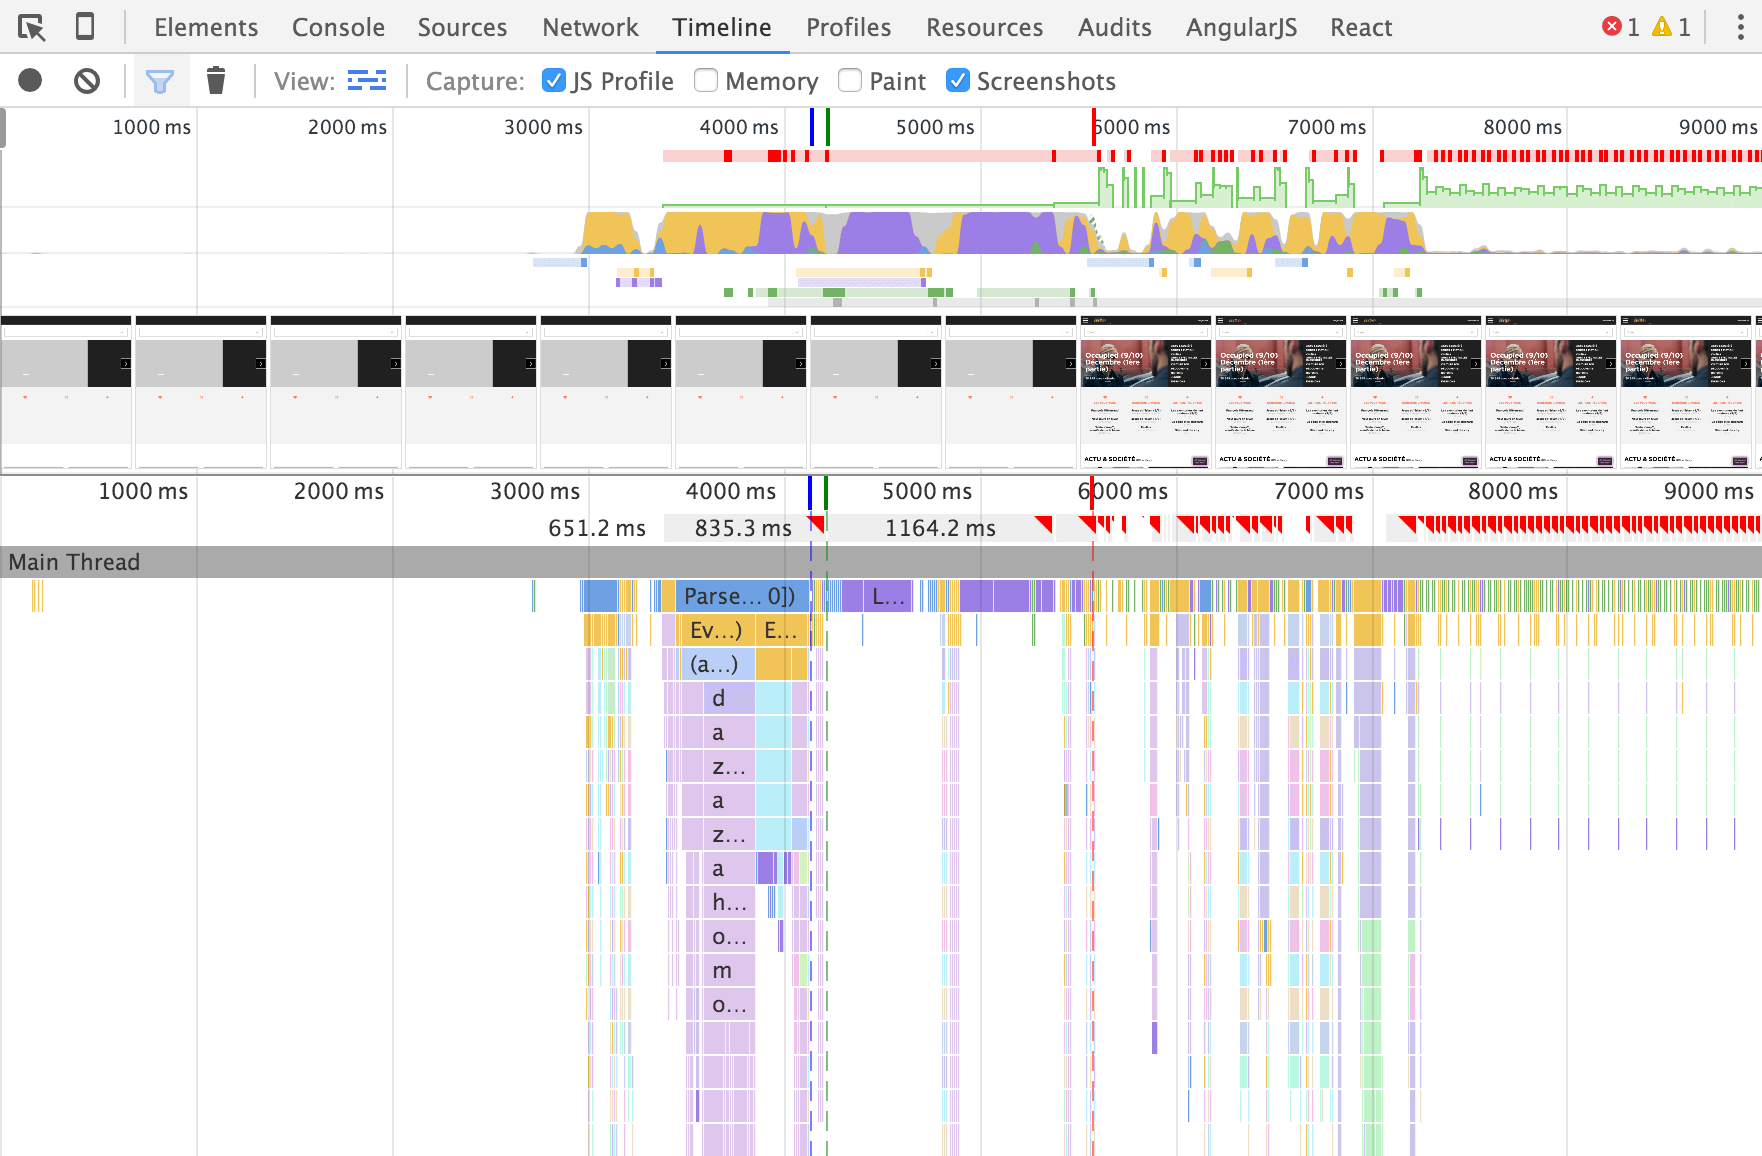
Google Chrome timeline is a great tool that you can use to record a page display process as a series of screenshots:

If you want to test your website from a different location than yours, or with another browser, use webpagetest.org. This tool provides a lot of metrics to help you better understand what is happening during browsing load time and let you compare different selections of locations, browsers, etc.
Using a profiler also helps. All major browsers like Google Chrome and Firefox provide profiling tools. Trigger a JavaScript profile using the "Profile" tab of your browser developer tools.
Stylesheets
Stylesheets are probably one of the most difficult parts of a website to optimize. Here is a quick overview of some optimization techniques:
- Remove unused CSS rules: CSS rules accumulate over time; you add new ones but rarely remove obsolete ones. Also, if you are using a CSS framework like Bootstrap or Foundation, you are probably not using more than 30% of all their features. A tool like Uncss can help you remove unnecessary CSS rules.
- Optimize the CSS critical path: Inlining CSS for anything above-the-fold makes rendering faster, anything else can be loaded asynchronously; this is what a tool like Critical does.
- Minify and Compress your files.
- Analyze Stylesheets complexity: Parker is a tool that helps you measure CSS complexity. Complexity also comes from small things like slightly different colors used throughout your code, something that Colorguard detects and helps resolve.
Google Chrome developer tools provide an "Audit" tab that helps diagnose some CSS issues:

To test your optimizations, use automated tools like PhantomCSS, huxley, Wraith, or Needle.
Also watch Addy Osmani's presentation on CSS performance tooling.
The Future
You should start looking at two interesting technologies that could help making your application blazing fast: Google AMP and the Service Workers API.
Google AMP for accelerated mobile pages is a project that should provide a way to write web applications in HTML/JS using components that will be rendered fast. You can test the technology on the project website.
Service Worker API is a standard JavaScript API that brings the power of native applications to the web. It acts as a proxy between web applications, the browser, and the network. It provides a way to handle offline usages of web applications, server push notifications, and background synchronization.
This blog post is an interesting read about instant loading web page using the application shell architecture and service workers.
Automating Frontend Performance
Like for unit tests, you need to keep an eye on the frontend performance in an automated way. There are quite a few tools that you can use:
- WebPageTest: Provides a console tool to automate tests you can run on webpagetest.org;
- Grunt Perf Budget: Enforces your performance budget, built on top of WebPageTest;
- PageSpeedInsight: Wraps Google Page Speed Insight in a console tool;
- Phantomas: Generates performance metrics using PhantomJS.
Conclusion
Remember that a website is only usable by your end user once the interface is understandable by the user and all blocking processes are finished.
One last piece of advice from Addy Osmani:
When you want to be fast, you have to give up the thing slowing you down.