Understanding Comparisons
One of Blackfire Profiler's key features is the ability to compare profiles. This helps users understand the differences between two versions of the same endpoint or the discrepancies between samples taken days apart.
Knowing if changes in the code base or the application configuration have introduced side effects on other parts of the code while working on a new feature is really helpful—anticipating the consequences of changes is even better.
Comparing two Profiles
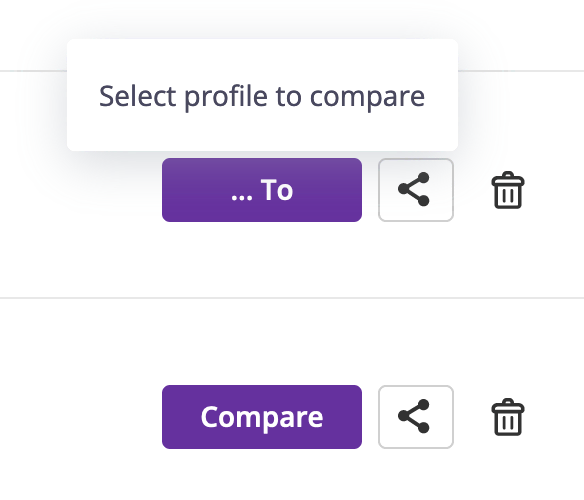
Comparisons can be initiated from the profile list. A compare button on the right-hand side of each profile allows you to select the source and the destination of this comparison.

The graph is a superposition of all calls from the two original graphs. The number displayed in a node is the performance gain or loss for the node itself, including all its children.

Single Nodes
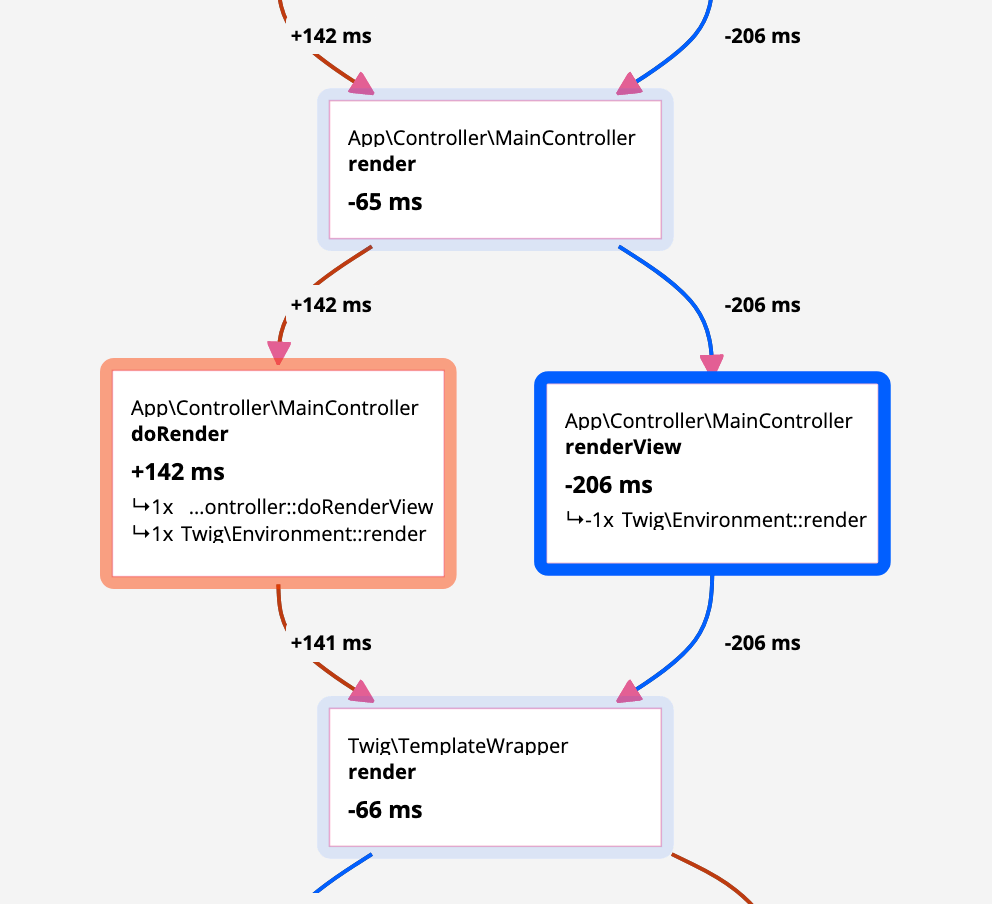
When the path between two shared nodes is different, the nodes for profile A path are displayed on the left side of the graph and on the right side for profile B (each side can be empty).
The background color and the number are not relevant.
Performance Changes
Performance changes only make sense for shared nodes; calculating the gain or loss between two shared nodes is as simple as subtracting their numbers.
When a portion of the graph is different for profile A and B, the performance gain or loss can be calculated by subtracting the number of the first shared node before the split and the first shared node after the split.
Let's take some examples:

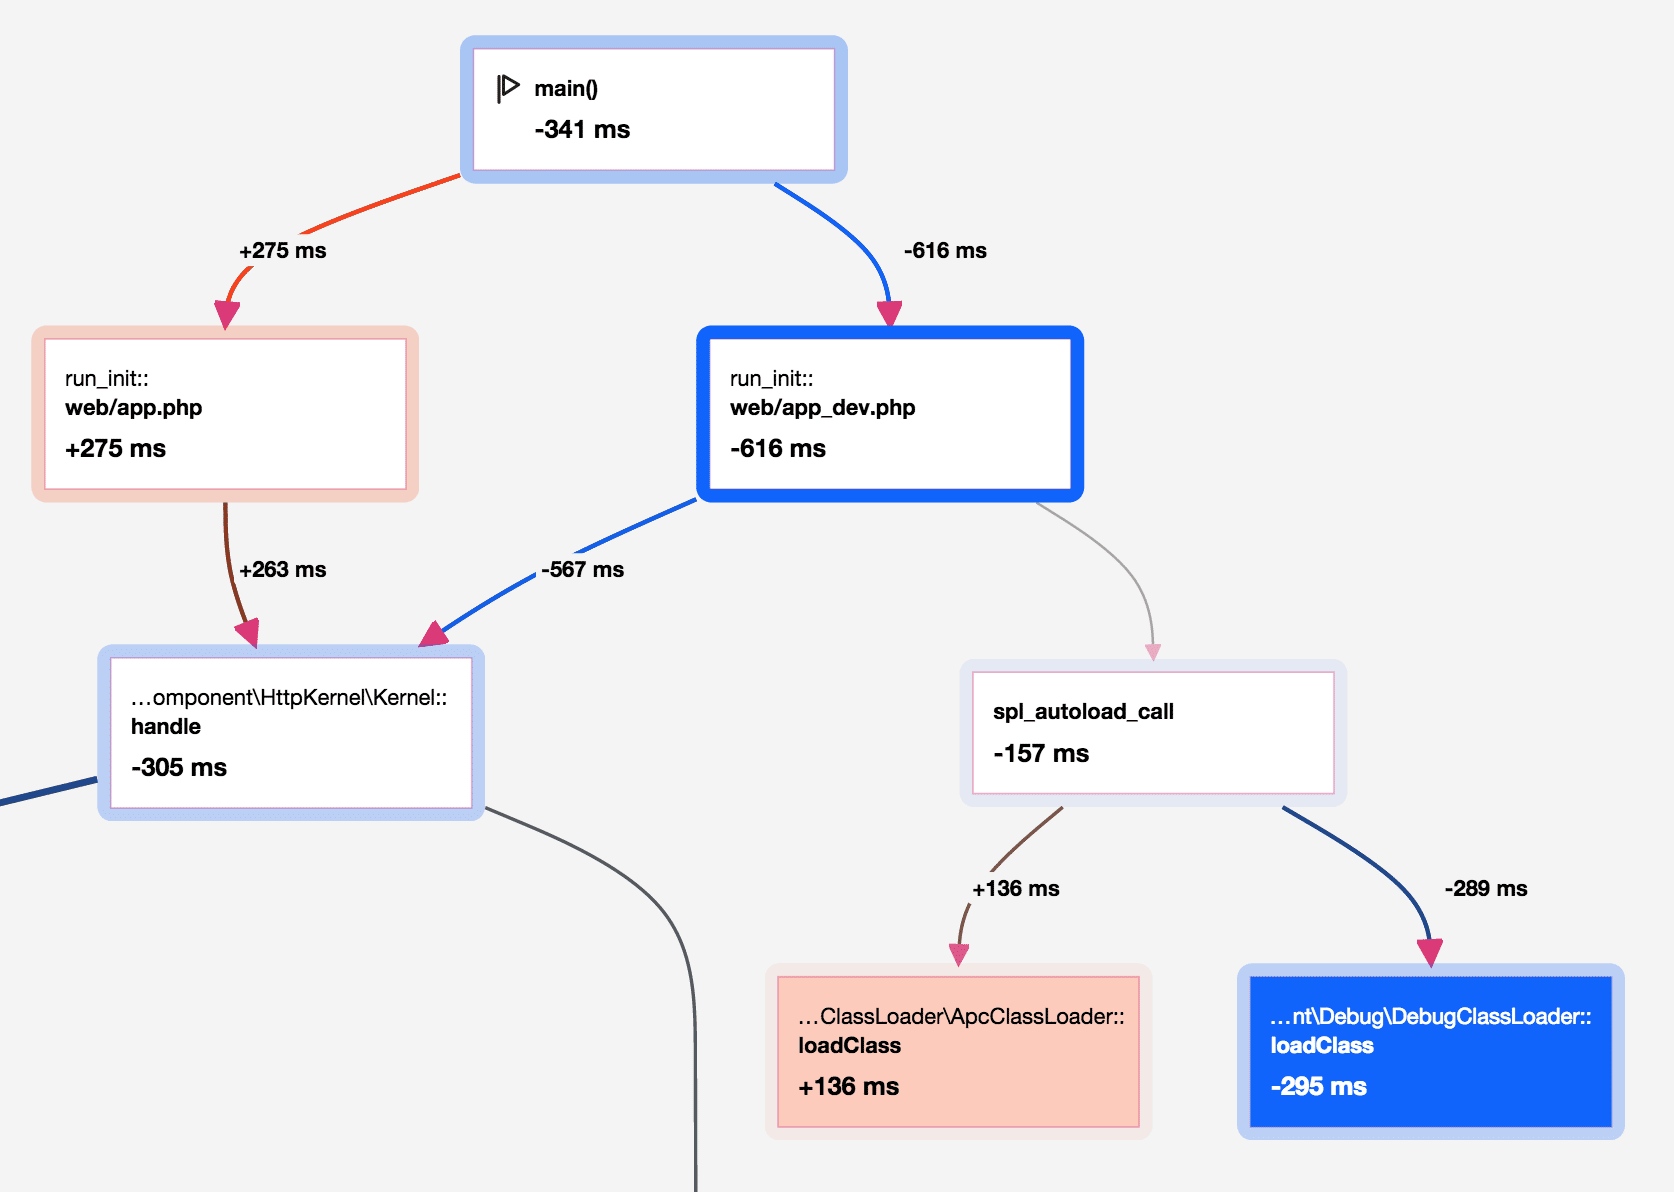
On this graph, the code from the B profile is faster than the code from the A
profile as the main() node displays a -341ms.

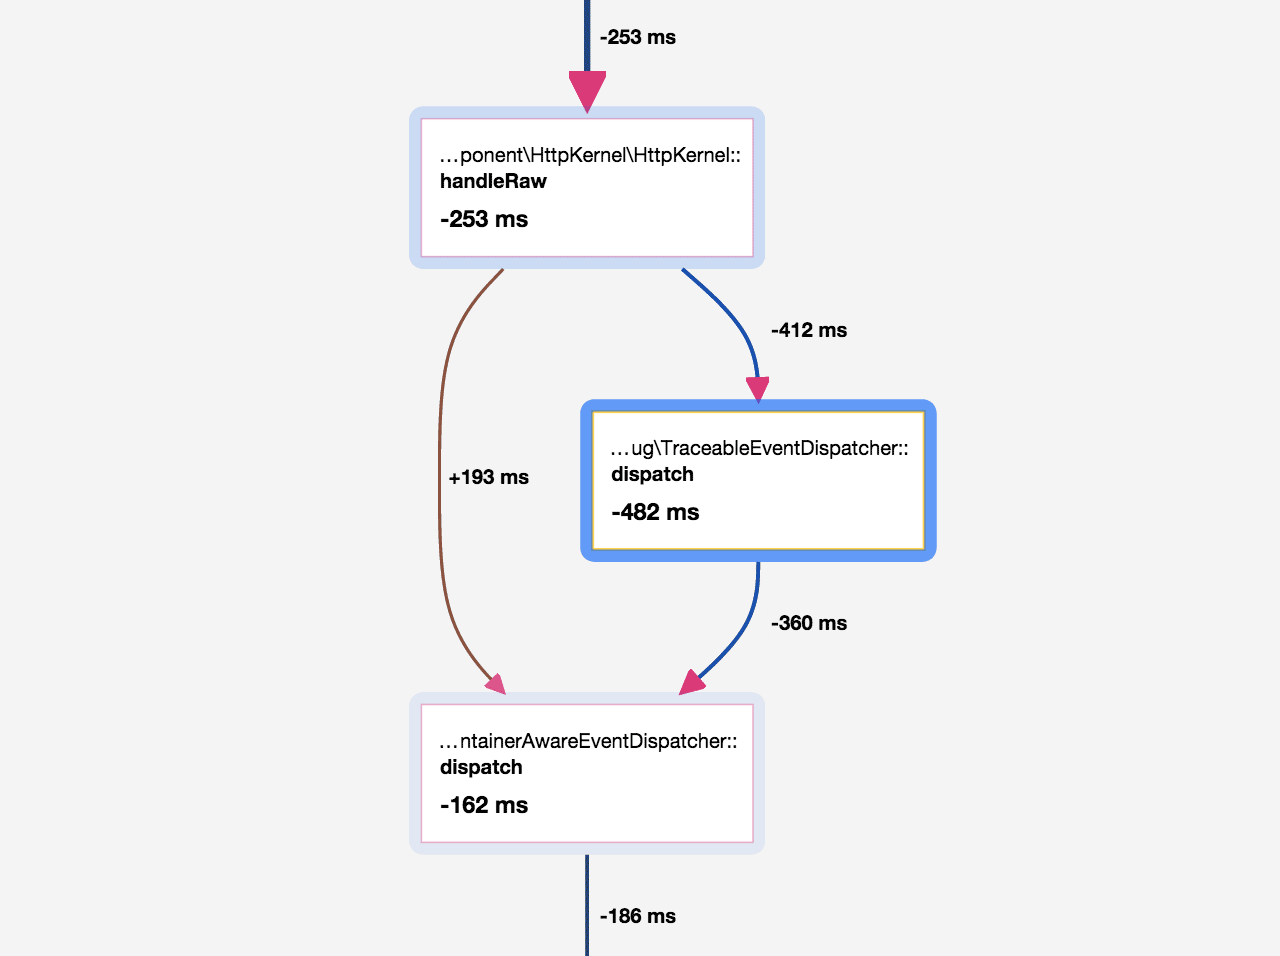
On this graph, there is a function call that is only present on profile A. The
performance improvement of this call removal is -91ms (-253ms - -162ms).