Loading...
Understanding HTTP Requests
The HTTP tab of a profile contains a list of all the HTTP requests the profiled script made.
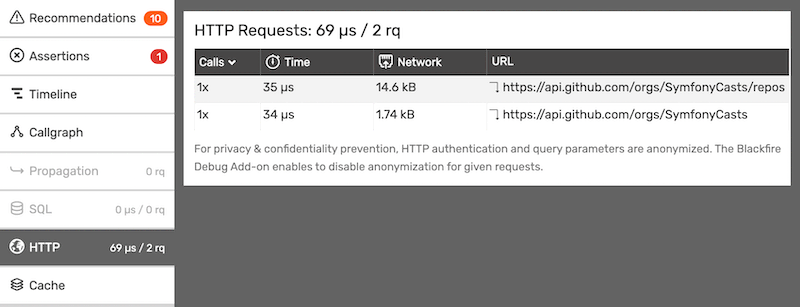
The list contains:
- the number of calls made to that URL;
- the related wall-time;
- and the network consumption.
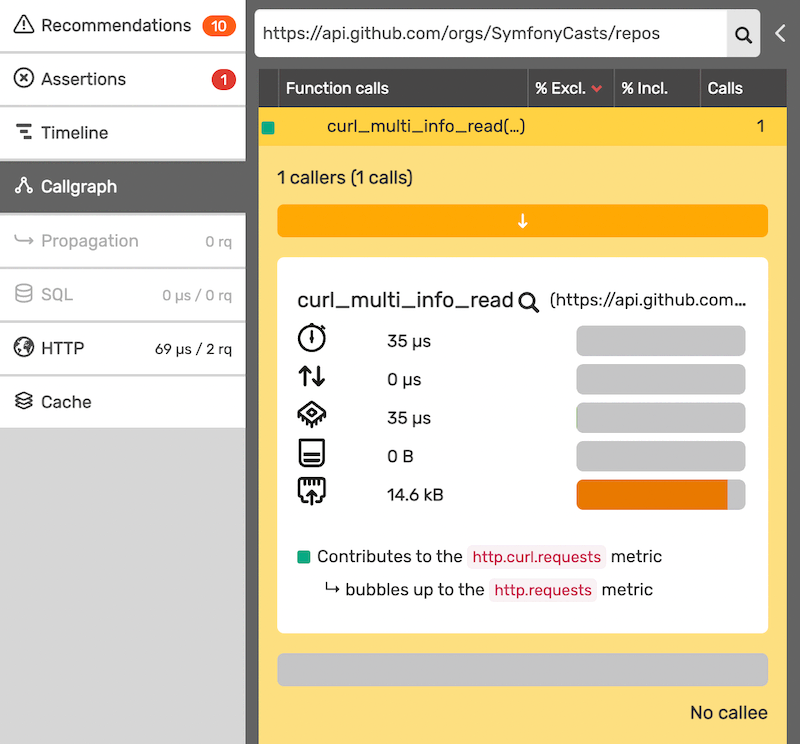
The displayed wall-time refers to the function gathering information on the
query. For instance, it could be curl_multi_info_read for a cURL query.
Request Metadata
The Request Metadata are displayed by clicking on the URL in the list.
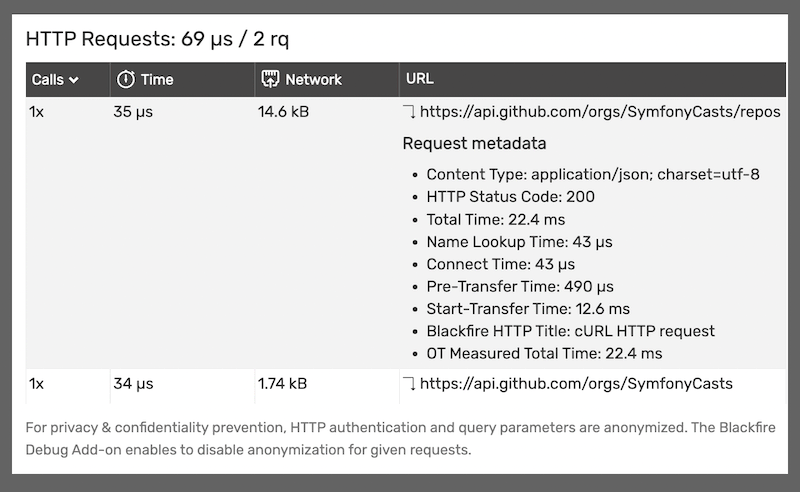
The Metadata may contain:
- the request Content-Type;
- the HTTP Status Code;
- the Total Time: time from the request start until the end of the transfer. When a redirect is followed, the time from each request is added together;
a breakdown of the Total Time:
- Domain Name lookup time: time from the request start until the name resolving was completed;
- Connect Time: time from the request start until the connection to the remote host (or proxy) was completed. When a redirect is followed, the time from each request is added together;
- Pre-Transfer Time: time from the request start until the file transfer is about to begin. When a redirect is followed, the time from each request is added together;
- Start-Transfer Time: time from the request start until the first byte is received. When a redirect is followed, the time from each request is added together;
- an eventual title for that request;
- and the Open Telemetry Measured Total Time.
Naming an HTTP request
The Blackfire HTTP Title field of the HTTP Request Metadata can be defined by
adding the X-Blackfire-HTTP-Query-Title header to the request.
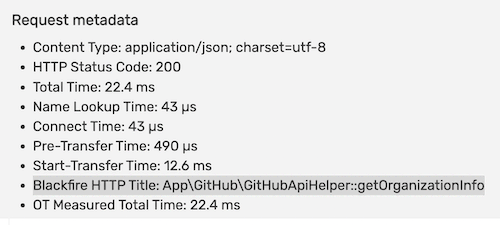
This title can provide a context easing the understanding of the profiles of applications heavily relying on external HTTP requests.