Understanding Timelines
This section describes how to read the timeline of a profile. You can also visualize a profile as a call graph.
The timeline representation of a profile is a great way to analyze the wall-clock time of the most important function calls, which are represented as event blocks.
Understanding the Timeline Interface
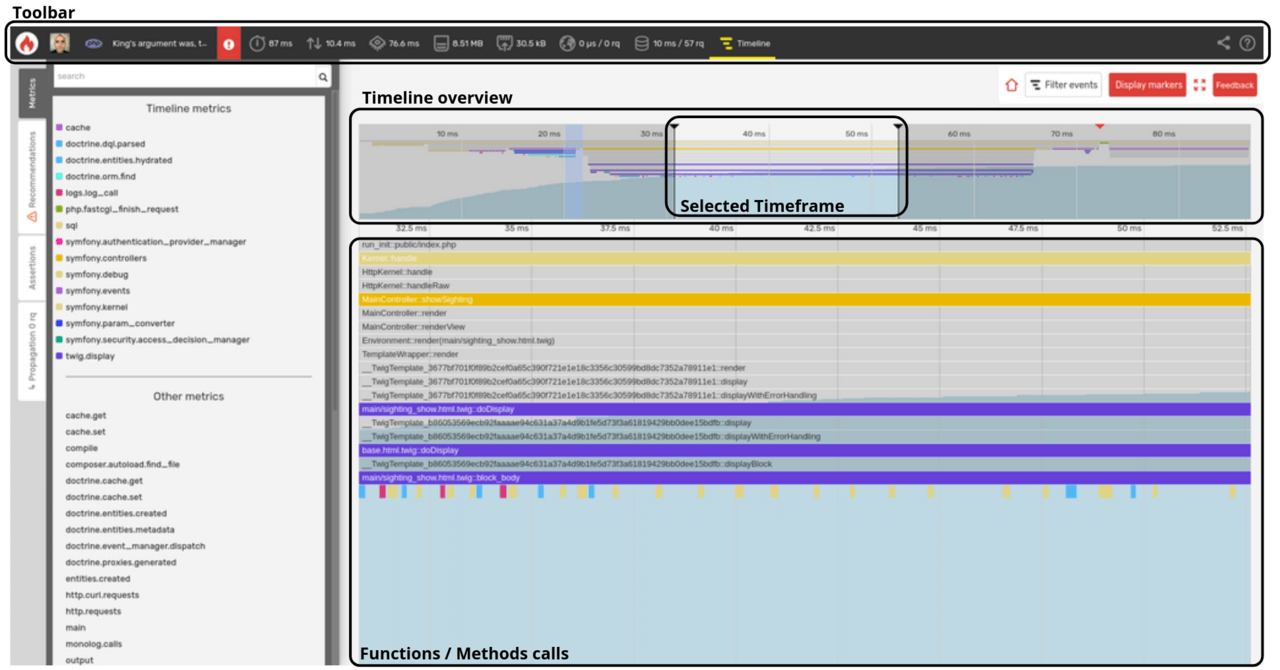
The timeline interface is divided into three sections:

- Toolbar: displays a summary of the main profile information and provides access to call-graph views for available dimensions, as well as SQL and HTTP queries lists;
- specific parts;
- Timeline: displays the list of executed functions and/or methods. The callers are on top and the callees below. The blue wave represents the cumulative memory consumption.
It is possible to zoom in and focus on a specific timeframe of the timeline. This may be helpful to drill down on specific function calls.
Like for the call-graph, Blackfire filters unimportant calls to only display the most significant ones. Blackfire also automatically understands which libraries you are using and groups similar calls as metrics that show up in the left pane.
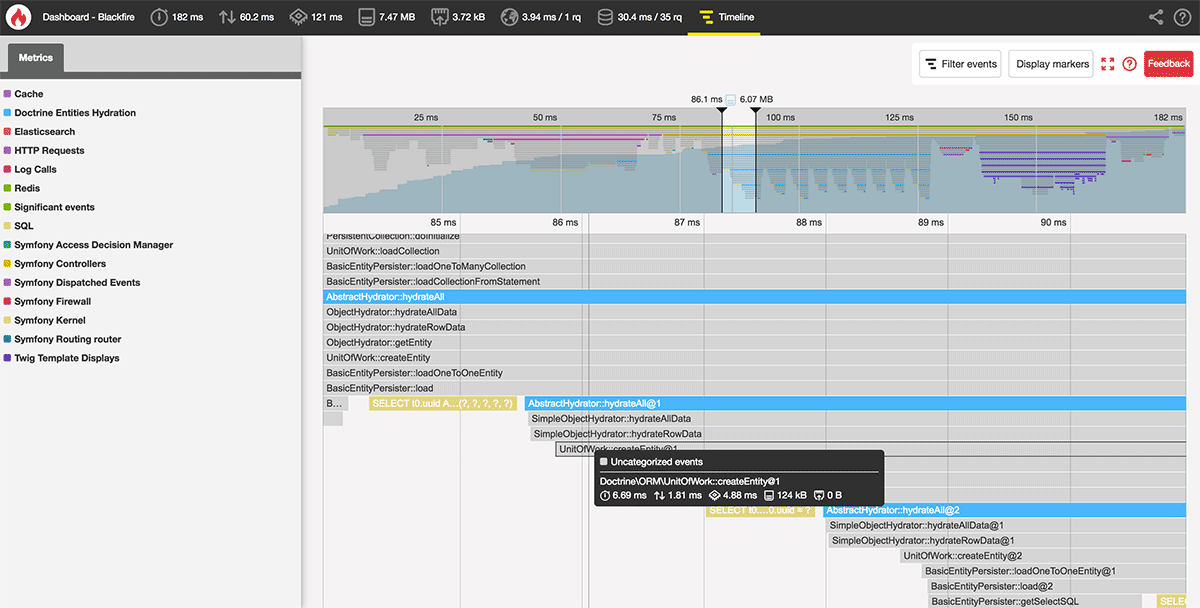
- Hovering on a metric emphasizes related blocks and displays resource consumption information about them;
- Hovering on a block displays more information about resource consumption.

Memory Consumption
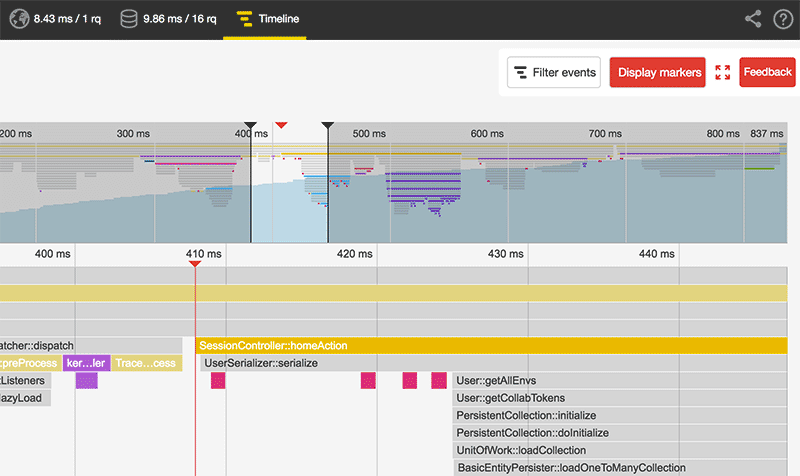
The global memory usage is displayed in the navigation panel as a light blue graph. It represents the growing peak memory envelope. A sudden increase can give you a hint on which function calls consume more memory.
On PHP profiles, the memory graph is an always-growing-graph. As it represents the peak memory, you can never see it decreasing, even if you manually clear your application memory.
Timeline Threshold
The threshold timeline metric highlights one or several event blocks in the
Timeline view. It is designed to draw your attention to something that Blackfire
considers significant.
The Threshold Value
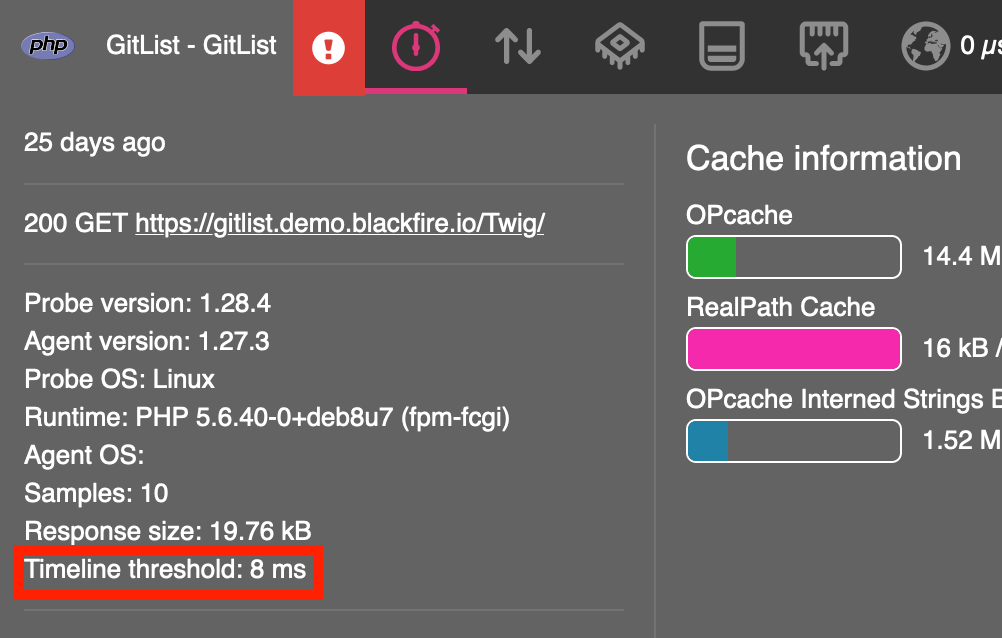
The timeline threshold is a value computed when a profile is triggered. When you ask for a profile with a Blackfire client, e.g. with Blackfire browser extension, it first fires a pre-flight request that will not be profiled. The duration of this request is taken as a reference to calculate the threshold value.
The threshold value is calculated as 1% of the duration of the pre-flight request.
This value is displayed in the metadata panel of your profile that you can view by hovering on your profile name.

This value is a reference for Blackfire to detect significant events for you.
Significant Events
Considering the threshold value, significant events are function calls that are worth paying attention to. An event is usually considered significant when its exclusive wall-time exceeds the threshold value.
Custom Metrics
The timeline only displays relevant metrics that are configured and curated by the Blackfire team.
But you can also add more information by creating your custom metrics ready for the timeline.
Markers
Markers allow you to visualize cue-points you explicitly define in your code.

There are 2 ways to add markers in the Timeline View:
- By adding an instruction in your code;
- By defining a metric.
Adding a Marker From Your Code
PHP
1
\BlackfireProbe::addMarker('My Marker Name');Python
1
2
from blackfire import probe
probe.add_marker('My Marker Name')
Adding these instructions is production safe. When no profile is requested, this function call operates as a no-op instruction.