Time
Time is probably the most interesting dimension you need to look at when trying to optimize the performance of an application. But time comes in several flavors.
All times displayed in the Blackfire interface can be more accurately referred to as wall-clock times or just wall times.
The wall time for a function call (represented as a node in the interface) is the measure of the real time it took to execute the code, the difference between the time at which the function was entered and the time at which the function was left.
Blackfire gives you two wall times:
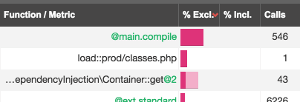
- The inclusive time, when the time includes the wall time for the function call including the inclusive time for all its children (the inclusive wall-time);
- The exclusive time is the time spent in the function itself, excluding time spent in children.
The wall time is made of two parts:
- The CPU time is the amount of time for which the CPU was used for processing instructions;
- The I/O time is the time the CPU waited for input/output (I/O) operations (network, disk, ...)
How can you interpret those times?
The inclusive time allows you to determine the critical path of your application.
The exclusive time tells you which nodes consumed the most time by themselves; those are probably the ones you might want to optimize first.
The I/O time is a great way to spot nodes where some intensive I/O activities took place: some code waited for the network (database calls, Redis calls, HTTP calls, ...) or the disks (file inclusions, ...). Keep in mind that the I/O is rarely 0 as it also includes non-significant activities like memory access.
Inclusive versus Exclusive Costs?

In a profile, the code execution is represented as a graph of nodes; so each node can have parents and children. The exclusive cost is the amount of resources consumed by the node itself, without the costs of its children. The inclusive cost is the sum of the resources consumed by the node itself plus the costs of all its children (including the children of the children and so on).