Chapter 4 - Your First Profile
Time to get our hands dirty! In this chapter, we are going to profile a real application and use Blackfire's web interface to understand its behavior and find some code optimizations.
This chapter and the next do not require any language-dependent installation. The example code and application is hosted on a demo server, so that you can walk through the next steps without taking care of it.
The project we are going to work on is a blog-like demo project inspired from the Bigfoot/Sasquatch enthusiasts community, as illustrated on the dedicated Wikipedia page.
Finding Bigfoot was written in PHP with Symfony by Ryan Weaver and SymfonyCasts team for their Blackfire.io screencast: Revealing Performance Secrets with Profiling. The source code is is available at https://github.com/platformsh-templates/bigfoot-workshop.
For the purpose of this tutorial, we have created a special publicly profilable version of the Finding Bigfoot demo server at https://www.book.b7e.io/.
Our goal is to find bottlenecks in the Finding Bigfoot source code and, if we find any, propose changes to optimize its performance.
Step 1: Gathering Data
The first step in our quest is to gather data about the behavior of the
current codebase by using the Blackfire profiler. To do that, we will
generate profiles for Finding Bigfoot's home page (/) and each of the tabs
on the home page: "A Sighting" (/sighting/135), "About" /about, and
"Login" (/login).
Before we do this, you will need to create an account on Blackfire.io if you don't have one yet. It takes less than a minute if you already have a GitHub, Google or Platform.sh account.
To trigger some Finding Bigfoot profiles, first install the Blackfire browser extension: for Firefox or for Google Chrome.
We are now ready to start our first profiling session!
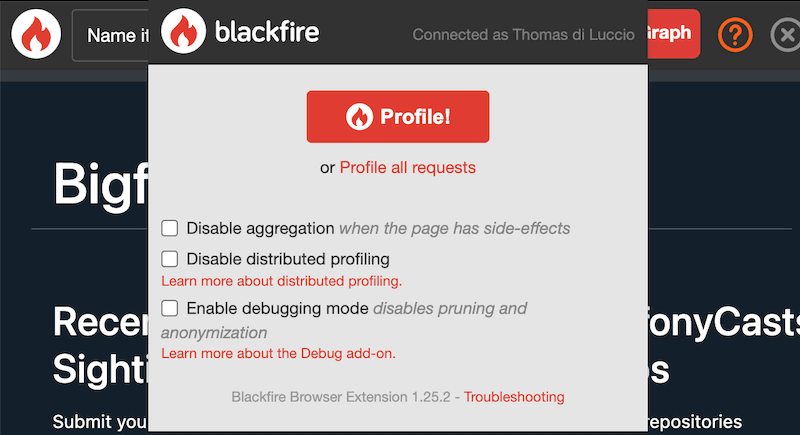
To profile the Finding Bigfoot homepage, go to https://www.book.b7e.io/, and trigger a profile by clicking on the Blackfire Extension icon:

By clicking the profile button, you have asked Blackfire to begin profiling the page currently displayed in the browser. You should see a black toolbar at the top of the browser window with a nice progress bar:

If anything does not work as described in this tutorial, do not hesitate to contact us.
As you can see, it takes way more time to profile the page than it took to display it initially. This is because Blackfire triggers several page reloads behind the scenes to get a larger sample size, aggregate the results, and present more accurate information. Relying on only a single profile is not ideal, as we discussed in the previous chapter.
At the end of the profiling process, the toolbar displays a summary of the profile:

This summary provides some basic information (your numbers may vary slightly, but should be similar), from left to right:
- 122 ms: the time it took for PHP to generate the Finding Bigfoot homepage;
- 32.2 ms: the I/O time;
- 89.5 ms: the CPU time;
- 5.54 MB: the amount of memory consumed by PHP.
For now, we are only going to focus on main time and memory. We will discuss I/O and CPU in later chapters.
Hooray! You've just generated your first profile.
It took around 120 ms for the server to generate the HTTP response. Is this good? Can we do better? When analyzing the performance of a project for the very first time, the slowest requests are the ones to optimize first. Now that we have our first profile, the baseline, let's profile another page and see if its performance is different from the homepage.
Let's profile one sighting page, https://www.book.b7e.io/sighting/135. Load this page in your browser and use the browser extension to trigger a profile.

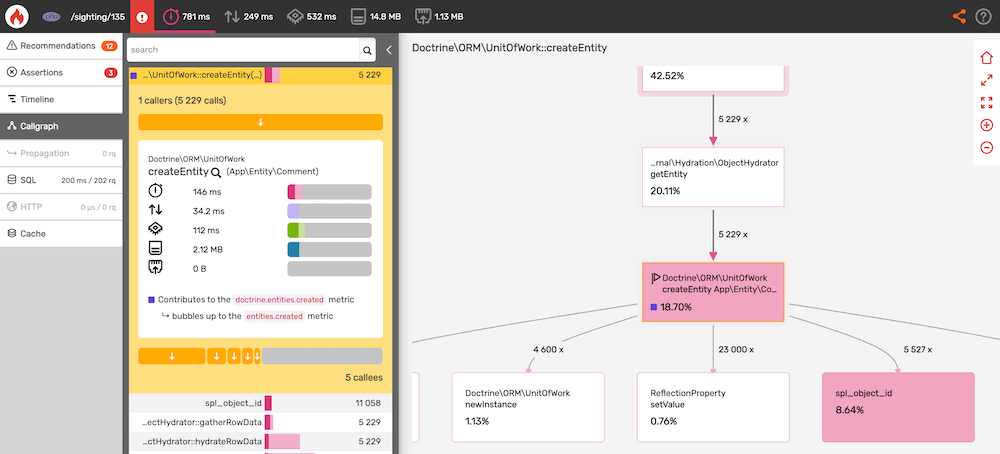
These numbers are quite different compared to the homepage. This page took 781ms to render (vs 122ms), and consumed around 14.8MB of memory (vs 5.54MB). It looks like this page can be optimized!
Step 2: Analyzing Profiles
The Blackfire summary toolbar is a good way to find which pages need to be optimized first, but then we need to dive deeper to better understand what's going on. Click on the "View Call Graph" button now. You should be redirected to the detailed profile on Blackfire.io.
Your profile should be similar to this one:
Now it's time to learn how to use the Blackfire interface to detect performance issues.
The table on the left side of the screen displays a list of the main functions and methods that were executed. Clicking on a function name reveals the resources consumed by this function, like time, memory, network, ...
By default, the most time-consuming function calls are listed first. These
functions are almost always where you want to look first. In our case,
Doctrine\ORM\UnitOfWork::createEntity() (createEntity(App\Entity\Comment))
comes first. It takes a significant amount of time to execute: almost 19% of the
total time for 5229 calls.
Doctrine\ORM\UnitOfWork::createEntity() is a function defined in Doctrine, a
third-party library used by Symfony to interact with databases. Therefore, it
cannot be easily optimized; but we can try to lower the number of times it is
called.
The next step is to understand which parts of userland code trigger these
calls. Click on the Doctrine\ORM\UnitOfWork::createEntity() link to reveal
this function's details, then click on the magnifying glass. The call graph will
now be redrawn and centered on this specific node:

The call graph displays the executed code as a visual diagram where each node corresponds to a function or method call. The edges of the graph show the execution flow.
Now that we are focused on the PDOStatement::execute() node, drag the graph
up with your mouse until you find the
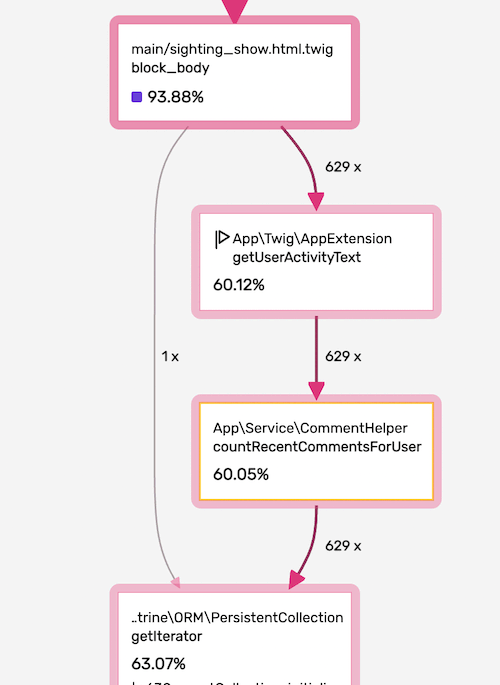
App\Twig\AppExtension::getUserActivityText() and
App\Service\CommentHelper::countRecentCommentsForUser() nodes. These are the
first calls defined in userland PHP and the ones which we are most
interested in:

Step 3: Optimizing the Code
The App\Service\CommentHelper::countRecentCommentsForUser method is called
629 times and accounts for 60% of the total execution time, that's a lot. It
is being called by App\Twig\AppExtension::getUserActivityText()
whose implementation reads as follows:
1
2
3
4
5
6
7
8
9
10
11
12
13
14
15
16
17
18
public function getUserActivityText(User $user): string
{
    $commentCount = $this->commentHelper->countRecentCommentsForUser($user);

    if ($commentCount > 50) {
        return 'bigfoot fanatic';
    }

    if ($commentCount > 30) {
        return 'believer';
    }

    if ($commentCount > 20) {
        return 'hobbyist';
    }

    return 'skeptic';
}
We are retrieving the number of recent comments a user left to display a
specific label. It may be interesting to carry on the investigation by checking
the implementation of countRecentCommentsForUser():
1
2
3
4
5
6
7
8
9
10
11
12
13
public function countRecentCommentsForUser(User $user): int
{
    $comments = $user->getComments();
    $commentCount = 0;
    $recentDate = new \DateTimeImmutable('-3 months');
    foreach ($comments as $comment) {
        if ($comment->getCreatedAt() > $recentDate) {
            $commentCount++;
        }
    }

    return $commentCount;
}
Apparently, we are getting and hydrating all the comments a user made only to count the most recent ones iterating over them. This is quite an inefficient way of achieving our goal.
To refactor this, we can add a method in the CommentRepository class,
which is used to interact with the database with Doctrine. This method will
directly return the count of recent comments for a given user:
1
2
3
4
5
6
7
8
9
10
11
public function countForUser(User $user, \DateTimeImmutable $sinceDate): int
{
    return (int) $this->createQueryBuilder('comment')
        ->select('COUNT(comment.id)')
        ->andWhere('comment.owner = :user')
        ->andWhere('comment.createdAt >= :sinceDate')
        ->setParameter('user', $user)
        ->setParameter('sinceDate', $sinceDate)
        ->getQuery()
        ->getSingleScalarResult();
}
We can now simply update our countRecentCommentsForUser method to use our
new method:
1
2
3
4
5
6
7
8
9
10
11
12
13
14
15
16
17
18
19
<?php

namespace App\Service;

use App\Entity\User;
use App\Repository\CommentRepository;

class CommentHelper
{
    public function __construct(
        private CommentRepository $commentRepository
    ) { }

    public function countRecentCommentsForUser(User $user): int
    {
        return $this->commentRepository
            ->countForUser($user, new \DateTimeImmutable('-3 months'));
    }
}
And that's it. In less than 5 minutes, in a codebase we knew nothing about before, we've already found a performance bottleneck and written a patch.
Blackfire provided us the tools necessary to understand the code's actual behavior and showed us front and center exactly where to look to improve its performance.
We call that the "Blackfire effect", and lots of people are experiencing it on their projects:
Woot! Thanks to @blackfireio, @michaelthieulin and I optimized one of the backoffice pages of @dayuse_fr. The page was taking 18 seconds to load due to a misconfiguration of our @MongoDB indexes on a 15M documents collection. Now, the pages loads within 200 ms. x.com/KmX4yYxTd6
— Hugo Hamon (@hhamon) July 3, 2018
Used @blackfireio seriously for the first time yesterday. Went from 1min 39s to 2.98s on some heavy data processing code... It transformed our workflow in amazing ways. Thanks!
— belisar (@belisar) March 24, 2018
I think I found a way to improve performance by 15% in @phpunit using @blackfireio. Our unit tests take 17 seconds normally and with the changes it shaves off a few seconds. When running a code coverage report with xdebug on it shaves off several minutes. I will submit a PR soon.
— Jonathan H. Wage (@jwage) February 13, 2018
Optimizing colinodell/json5 with @blackfireiohttps://x.com/nwFI5d9AHN #php #performance
— 👨💻 Colin O'Dell (@colinodell) January 14, 2018
With #Symfony 3.4/4.0, enabling param `container.dumper.inline_class_loader` can boost your dev env perf by 50% and your prod by +2%. For free as usual :) /cc @blackfireio x.com/vvPoZlTZEb
— Nicolas Grekas (@nicolasgrekas) November 10, 2017
Conclusion
This is great, but we're not done yet. The complete process of performance optimization includes checking the impact of your code changes. First by running the unit tests to confirm that nothing is broken. Then, always compare the data between the current version of the code and the patched version to validate that the fix actually solves the problem and doesn't introduce regressions in other parts of the code.
Performance comparisons are a key feature of Blackfire; one that we will look at in depth in the next chapter.