Chapter 9 - Call Graphs Galore
In the previous chapters, we analyzed some call graphs, but we never fully explained what they represent and how to read them efficiently. Let's dive into the wonderful world of call graphs.
Call Graphs
Blackfire records the functions called during the execution of a program and their relationships as a call graph. A call graph knows nothing about when a function was called, but it reports the sequence of calls between functions.
In a call graph, nodes represent functions and edges the calls between them:
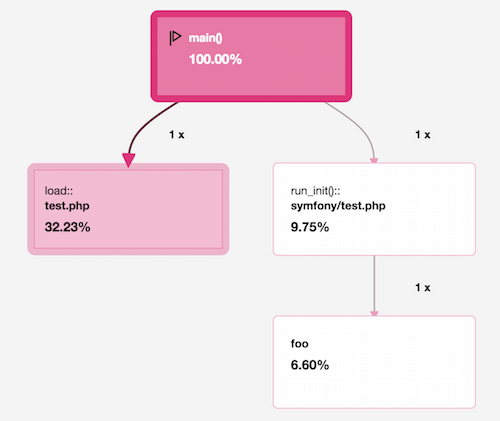
A node that has one or more children is called a caller for these child nodes; a node that has a parent is called a callee of this parent node.
When we refer to a "function call" in this chapter, it can be a call to a
PHP function (foo()), a method call on an object ($foo->bar()), or
a static method call on a class (Foo::bar()).
To keep data small, Blackfire does not keep the full-context of calls (i.e. the arguments). Therefore, a node aggregates all calls to a function, regardless of the argument values. This is why each node has a count (the number of times the function was called) and why nodes can have more than one parent.
For some specific functions, Blackfire does keep one argument at most to gather useful generic information like SQL queries, HTTP requests, or specific information like the event name for the Symfony event dispatcher. In that case, specific nodes are created for each unique argument.
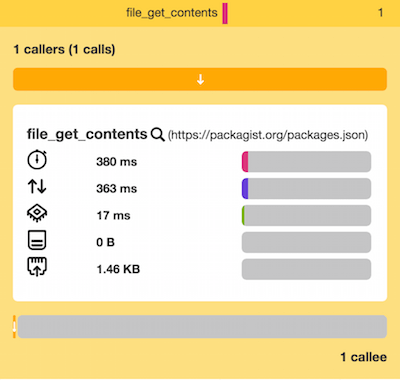
Having only one node for each function call greatly simplifies the
interpretation. But keep in mind that functions for which we gather an
argument consist of several nodes (using the search engine helps figure
that out), like for the file_get_contents() example above.
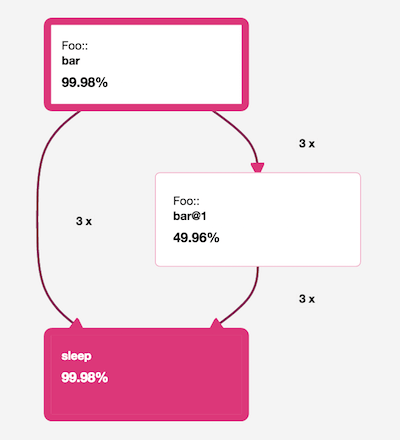
When generating a call graph, Blackfire does not cycle through the same node
multiple times for recursive calls. Instead, it creates additional nodes for
each recursive call and suffixes those nodes with @n. This type of graph,
called an acyclic graph, is much easier to read and makes calculating
exclusive costs much simpler.
A Blackfire call graph is selective in what it displays. When you profile an application with many, many function calls, you will not see so many nodes on the graph. This is because Blackfire cleans up the data. Small nodes (function calls that consume negligible resources) are hidden by default. However, you will see these minor nodes when you focus the graph on a caller or a callee, as all parents and children of the focused node are always displayed.
Blackfire also removes nodes that are too small to be optimized. They are represented in the functions table as a grey bar:
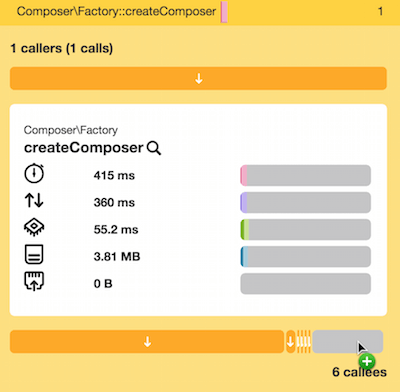
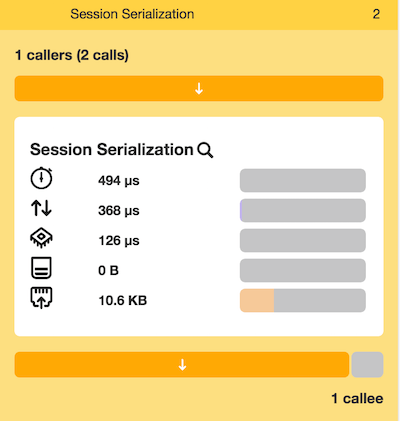
Blackfire also adds some special nodes that are not function calls per se like the main node, garbage collection, and session serialization. These nodes augment the call graph with useful information that helps us understand PHP's behavior while executing your code:
Extra Features
Blackfire's user interface has many additional features that make navigating your call graph a breeze:
The SQL queries and HTTP requests are available from the sidebar:

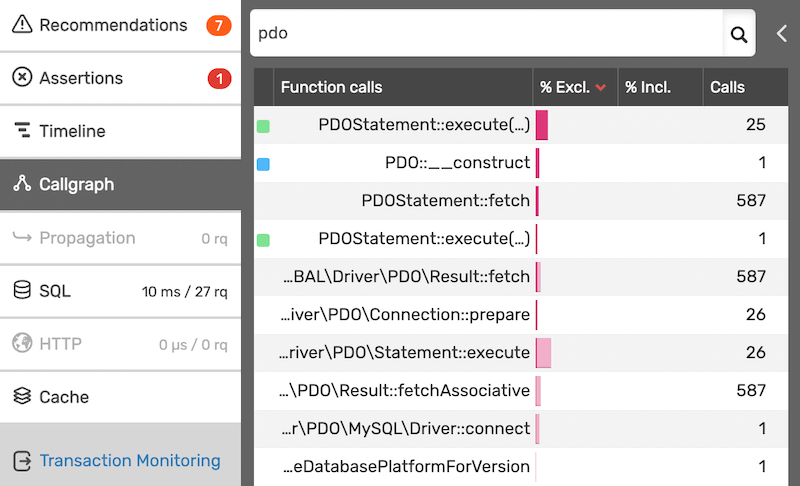
The search engine allows you to search for specific function names. It can also be used to display all calls coming from a specific class or namespace:
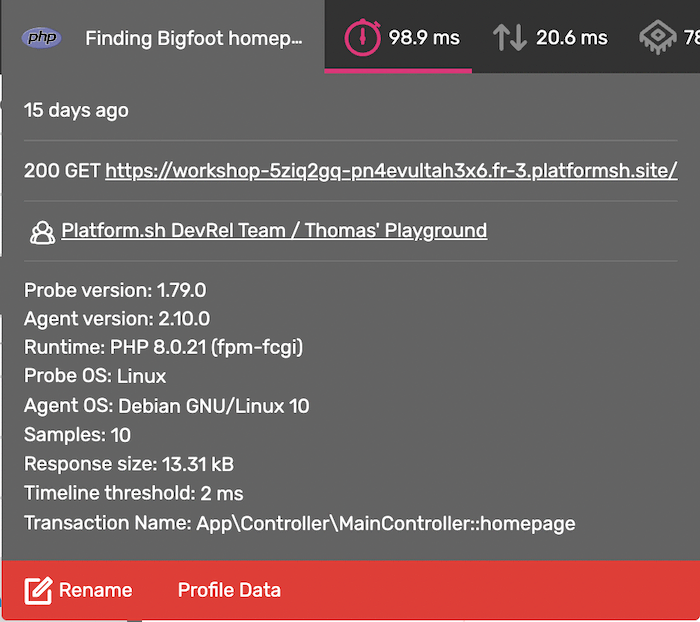
In the top left of the call graph, hover on the profile title to reveal all its metadata (the URL or the command that was profiled but also alerts like when was experiencing high load during the profiling session):
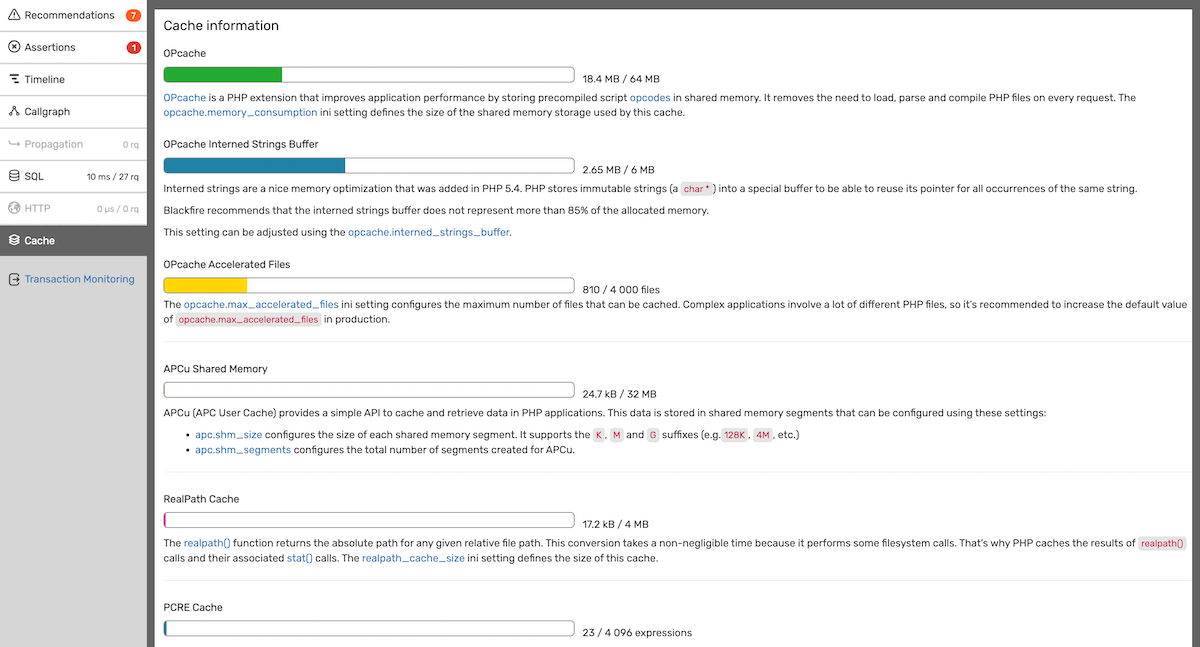
An extensive cache usage information is accessed from the sidebar:
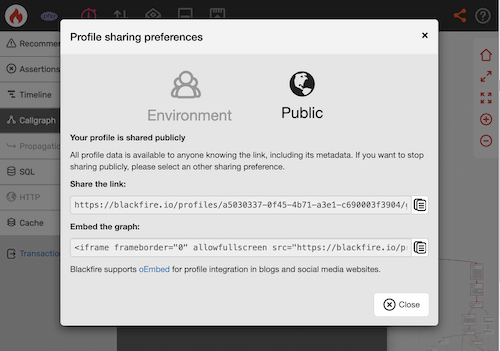
In the top right corner of the call graph, the sharing icon allows you to share profiles with anybody (be warned that shared profiles are public and anyone can access them; note that for sensitive call graphs, you can also collaborate on profiles privately by using Blackfire's environments):
Call Graph Analyzing Methodology
Looking at a call graph can be overwhelming. Where do you start? What are you looking for first? When do you stop?
The goal of any profiling session is to find the function calls or the group of function calls that consume the most resources and then be able to analyze their implementation and find ways to optimize them.
Don't forget one of Blackfire's core tenets:
Knowing when to stop optimizing is as important as knowing where to start.
The goal when profiling an application is never to optimize everything. Instead, Blackfire helps you find areas of your application to optimize that will give you the best improvements. That's exactly what we have done in the previous chapters. We were able to significantly optimize two Open-Source projects by applying some changes that were easy to apply once we knew where to look.
Focusing the Call Graph
All these methodologies help you find the function calls you need to optimize first. Whatever the methodology, when you find such a call, always focus on the corresponding node in the Blackfire interface so that you can see more context in the call graph. You can focus on a node from the call graph or from the function list by clicking on the magnifying glass:
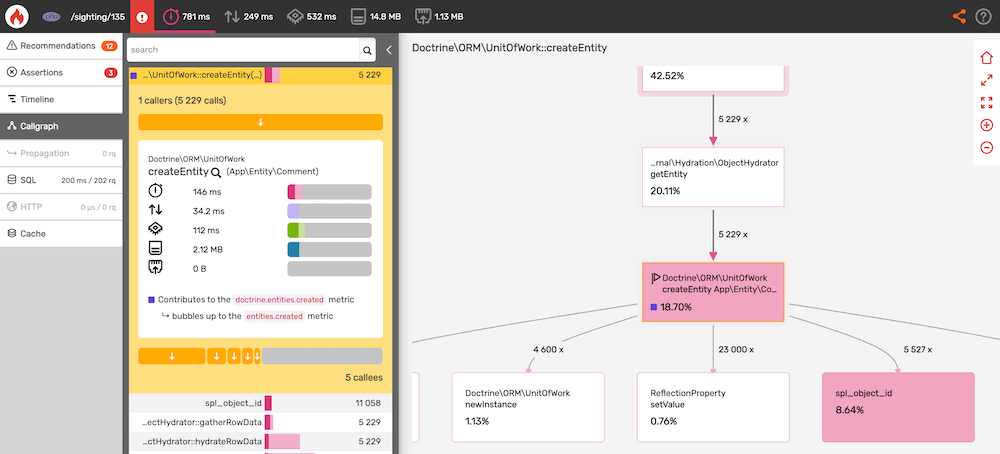
The call graph is then centered around the selected function call and all callers and callees are displayed, even the smaller ones. This view gives you more context to understand the real behavior of the code.
There are two main approaches to analyzing a call graph: the function calls first approach, and the call graph top/down approach. Both methods are complementary.
Remember that all methodologies apply to any dimension: call time, I/O time, CPU time, memory, and network.
Function Calls First Approach
This method involves looking first at the function table on the left side of the Blackfire interface.
First, sort the table by exclusive time (default sort), and focus on functions in the top 25 only, in this order of importance:
- calls coming from your code;
- calls coming from third-party libraries (you might submit a patch upstream quite as we've done in previous chapters).
Then, sort the table by number of calls and look for the same functions as above adding one more type:
- calls coming from PHP built-in functions or C extensions (the number of calls is probably the only way to improve their performance).
Never try to optimize a function with a high call count if its overall cost is negligible. This is never worth it.
This technique works great when there are a few calls that stand out; These cases are usually caused by developer mistakes (n + 1 queries, intensive function calls that could have been cached, large number of calls of a single function, ...).
Call Graph Top/Down Approach
This method involves following the critical path on the call graph to better understand how the code is executed by PHP.
On the call graph, the critical path is composed of all the nodes with a red
border. Start at the main node, then follow its children by navigating the
call graph with the mouse.
Whenever you encounter several branches, choose the branch that mostly involves function calls coming from your codebase.
Then, stop when a node looks like it could be optimized (i.e. if you see a significant drop in exclusive time).
This technique works well when it is not immediately obvious where to focus first. Also, once you find a node to look at more closely, you already have a better understanding of the context and what happened before.
Instead of following the call graph, you can perform the same technique directly from the function calls table by sorting it by inclusive time.
Checking the Cache Configuration
Correctly configuring PHP caches is critical for optimal performance: you should not get to a full cache. Anytime you profile your code, when viewing the profile data, check the cache information in the sidebar.
RealPath Cache
The realpath() function returns the absolute path for any given relative
file path. This conversion takes a non-negligible time because it performs some
filesystem calls. That's why PHP caches the results of realpath() calls and
their associated stat() calls. The realpath_cache_size ini setting
defines the size of this cache.
The realpath cache is only used for file paths that exist and is used for most of PHP filesystem calls. Complex applications involve a lot of file operations, so this cache size must be increased accordingly.
Interned Strings
Interned strings are a nice memory optimization that was added in PHP 5.4.
PHP stores immutable strings (a char *) into a special buffer to be able to
reuse its pointer for all occurrences of the same string. This setting can
be adjusted using the opcache.interned_strings_buffer.
Conclusion
One last bit of advice. Optimization is often a trade-off of time versus memory and performance versus code complexity. Sometimes, it is better to keep a slower implementation to preserve a simpler and more readable codebase. Blackfire is just a tool, don't apply a methodology blindly.
Blackfire provides a rich user interface that lets developers navigate through function calls to efficiently find performance issues.
Profiling should not always be a lonely activity. Teamwork often helps to make problems search and fixes writing go faster. Blackfire helps achieve better collaboration through environments, which is the topic for the next chapter.