Distributed Profiling
Requires Production Plan
Blackfire Distributed Profiling is a feature that makes it possible to profile any service your application interacts with, the most common being other HTTP applications such as micro-services.
When profiling with Blackfire, all eligible HTTP (and/or CLI) services involved with your main application are also profiled and generate Sub-Profiles.
Requirements
Distributed profiling is enabled by default.
The main technical requirements are the following:
- The probe must be enabled on all the services you want to trigger sub-profiles from;
- Blackfire HTTP headers must be preserved on the services your application calls.
A profile can be propagated to applications written in all languages supported by Blackfire.
For example, a profile of a CLI application written in Python can be propagated to an HTTP application written in PHP, and to another one written in any language Blackfire supports.
1
2
3
4
Python app (CLI)
├── PHP app (HTTP)
│   └── Python app (CLI)
└── Python app (HTTP)
How Does It Work?
Profiles and sub-profiles are linked with parent/child identifiers. These identifiers are either automatically generated by the probe, or in your code using the SDK.
Each profile is passed on to the agent and processed independently. Once they are sent to Blackfire servers, they are linked together as a hierarchy of calls.
You may use different Blackfire agents. These agents may be on different infrastructures, as long as the requirements are fulfilled.
Agents may even use different credentials, and can thus be linked to different Blackfire environments. The only requirement, in this case, is that the user who is profiling has access to the Blackfire environments which are tied to the different agents.
Experience Distributed Profiling
To discover distributed profiling, you can use the book.b7e.io/cascade application. It makes recursive HTTP calls that you can freely profile using the CLI.
1
On-demand Distributed Profile Processing
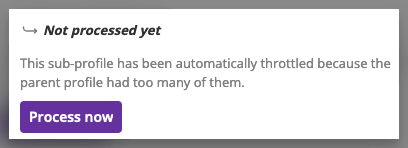
The first 5 sub-profiles are processed in priority. The eventual remaining ones are throttled, and their process can be manually requested.

Analyzing Distributed Profiles
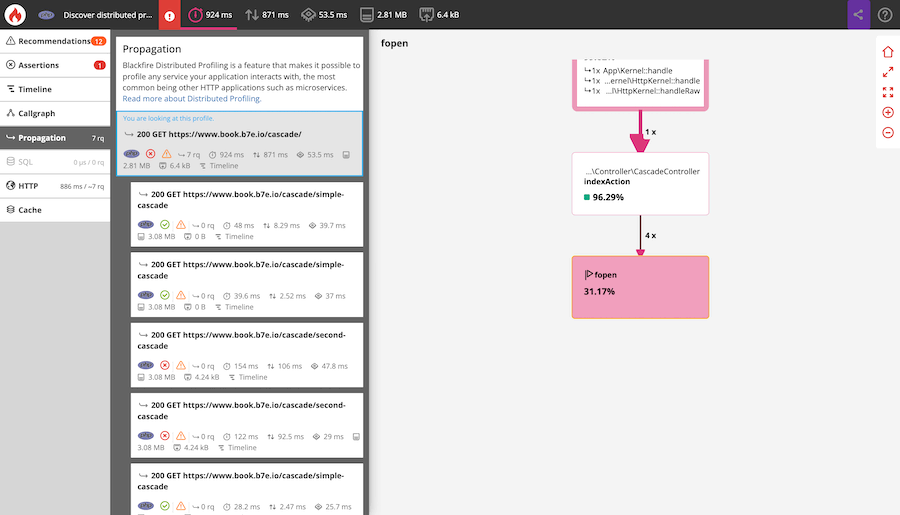
In the Blackfire user interface, the generated profile and its sub-profiles are gathered within the same view. This allows you to navigate from one profiled service to another. It also shows you dependencies between profiled services.

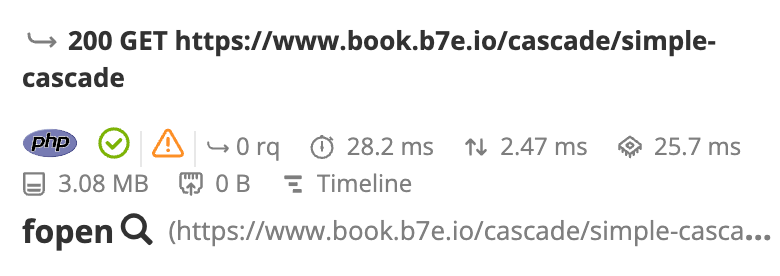
To locate a node that a sub-request is originated from, click on the magnifying
glass icon next to the caller function name (fopen() in the screenshot
below).

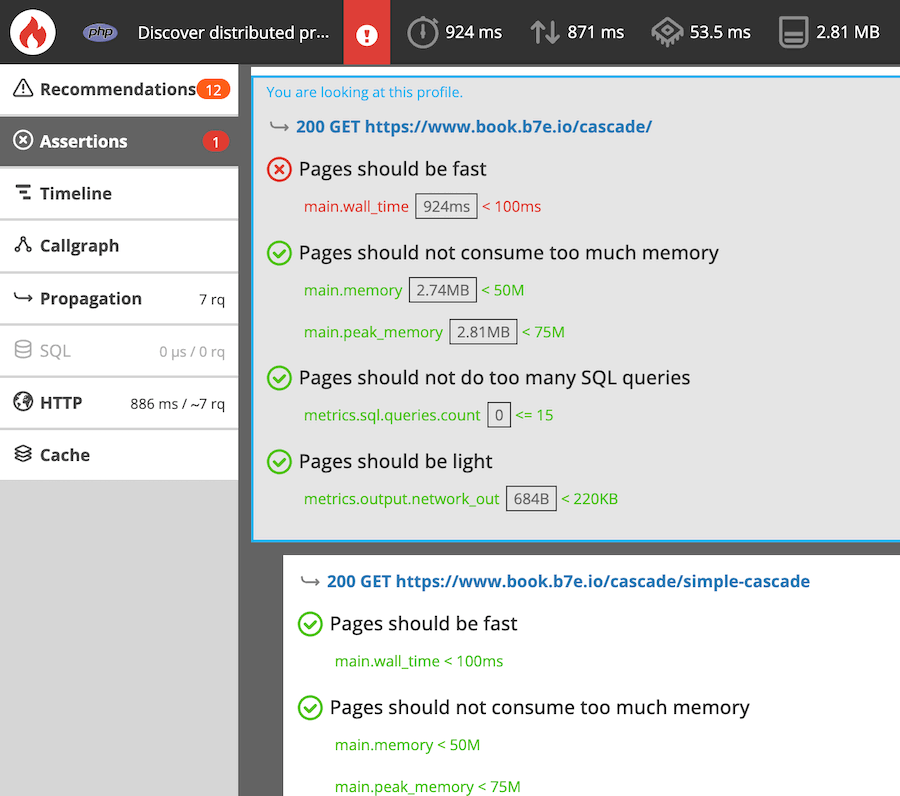
All the assertions and recommendations for each profiled request are also gathered in the same view. This enables the identification of bottlenecks, optimization possibilities, and which service is impacted.
