Profiling HTTP Requests with a Browser
Using a browser is the easiest way to profile web applications.
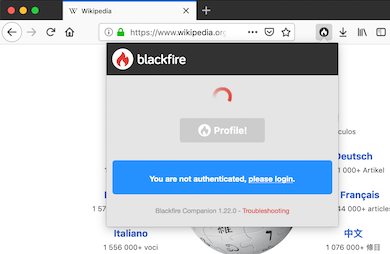
To get started, check that you have Blackfire installed correctly on the server hosting the website you want to profile and install the Firefox extension or the Google Chrome one.
If you need more flexibility, like profiling APIs, POST requests, or
adding specific HTTP headers, use the Blackfire CLI instead.
Profiling
To profile a web application from Firefox or Google Chrome:
Log in on Blackfire.io;

- Browse to the URL you want to profile;
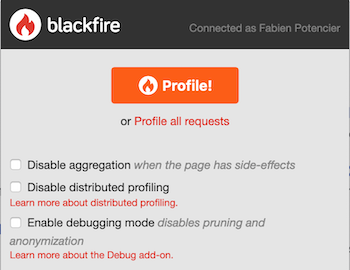
Open the extension by clicking on its icon in the browser toolbar;

- Click on the "Profile" button;
After a few seconds, click on "View Call Graph" or "View Timeline".

Copy-As-cURL in your Browser
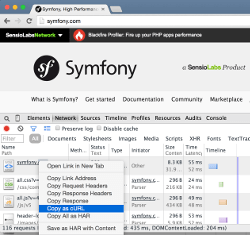
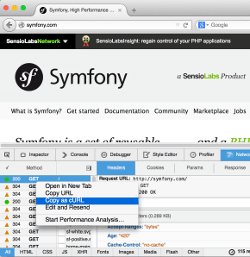
Did you know that browsers can give you the cURL arguments and options like HTTP headers to use for any web page you browse? Including Ajax requests?
This feature is known as "copy-as-cUrl". The result can be used directly with the Blackfire CLI to profile requests from the command line and to automate profiling in scripts:


Profiling all Requests
If you want to profile all pages from a session, open the extension and click on the "Profile all requests" link, then click on the Record! button.
Blackfire will then profile all requests including POST requests, Ajax requests, and API calls.
A pop-over window will open at the bottom right of your browser window, where all profiled requests will be listed. Stop the session by clicking on the Stop button.
All profiled requests will be available on your dashboard.
The "Profile all requests" feature is currently unavailable on Chrome due this browser limitations.
Limitations on 304 HTTP Responses
The browser extensions are not able to profile 304 HTTP responses as some Web
Servers remove custom headers such as the ones added by Blackfire to operate
correctly. To avoid 304 HTTP responses, the browser extensions remove any
conditional headers from requests; if you want to profile 304 responses, use
the Blackfire CLI curl command instead.